
Viewing Gantt Charts
Pick a chart, read the bars and rollups, expand to the level you need, filter to one team, look through another team's cadence, and save the result as a shareable view.
On this page
Once a chart exists (see Setting Up Gantt Charts), most of your time on it is spent reading, not editing. This page covers how to get the chart to show exactly the slice you need.
Pick a chart#
The Gantt picker sits at the left of the filter bar. Click it to see every chart you can open, grouped by Gantt group with ungrouped charts under Other, and type in Search to narrow the list. The chart name and description also appear above the table, with Edit gantt details and Delete this gantt if you can manage the chart.
The search at the top of the screen can jump straight to a chart too: type the chart's name, or type #roadmap to list the Gantts you opened recently. See Search & Recent Places.
The page address always names the chart you have open, and the saved view applied to it, the same way a board's address names its board. Copy the address from your browser to send someone straight to that chart; they need access to it to open it. Opening a chart link, or picking another chart in the Gantt picker, while a Gantt is already open switches to that chart, and your browser's Back button returns to the chart (and view) you had before; Forward goes to the chart you switched to.
Read the chart#
| You see | It means |
|---|---|
| A thin colored box spanning several rows | An initiative. Its box covers everything inside it; the color is the initiative's color. Hide Bounding Boxes in Options turns these off. |
| A solid bar | A workstream or item with a start and due date. Workstream bars show the title and completion, for example Checkout (40%), until they reach 100%. |
| A diamond | A milestone: a single date, no duration. |
| A partly filled bar | Progress. What fills the bar is set by Options → Show Bar Progress By (items completed, point estimate, time estimate, or hidden), counted from direct children or, with Progress from Lowest-Level Work on, from every item at the bottom of the tree. |
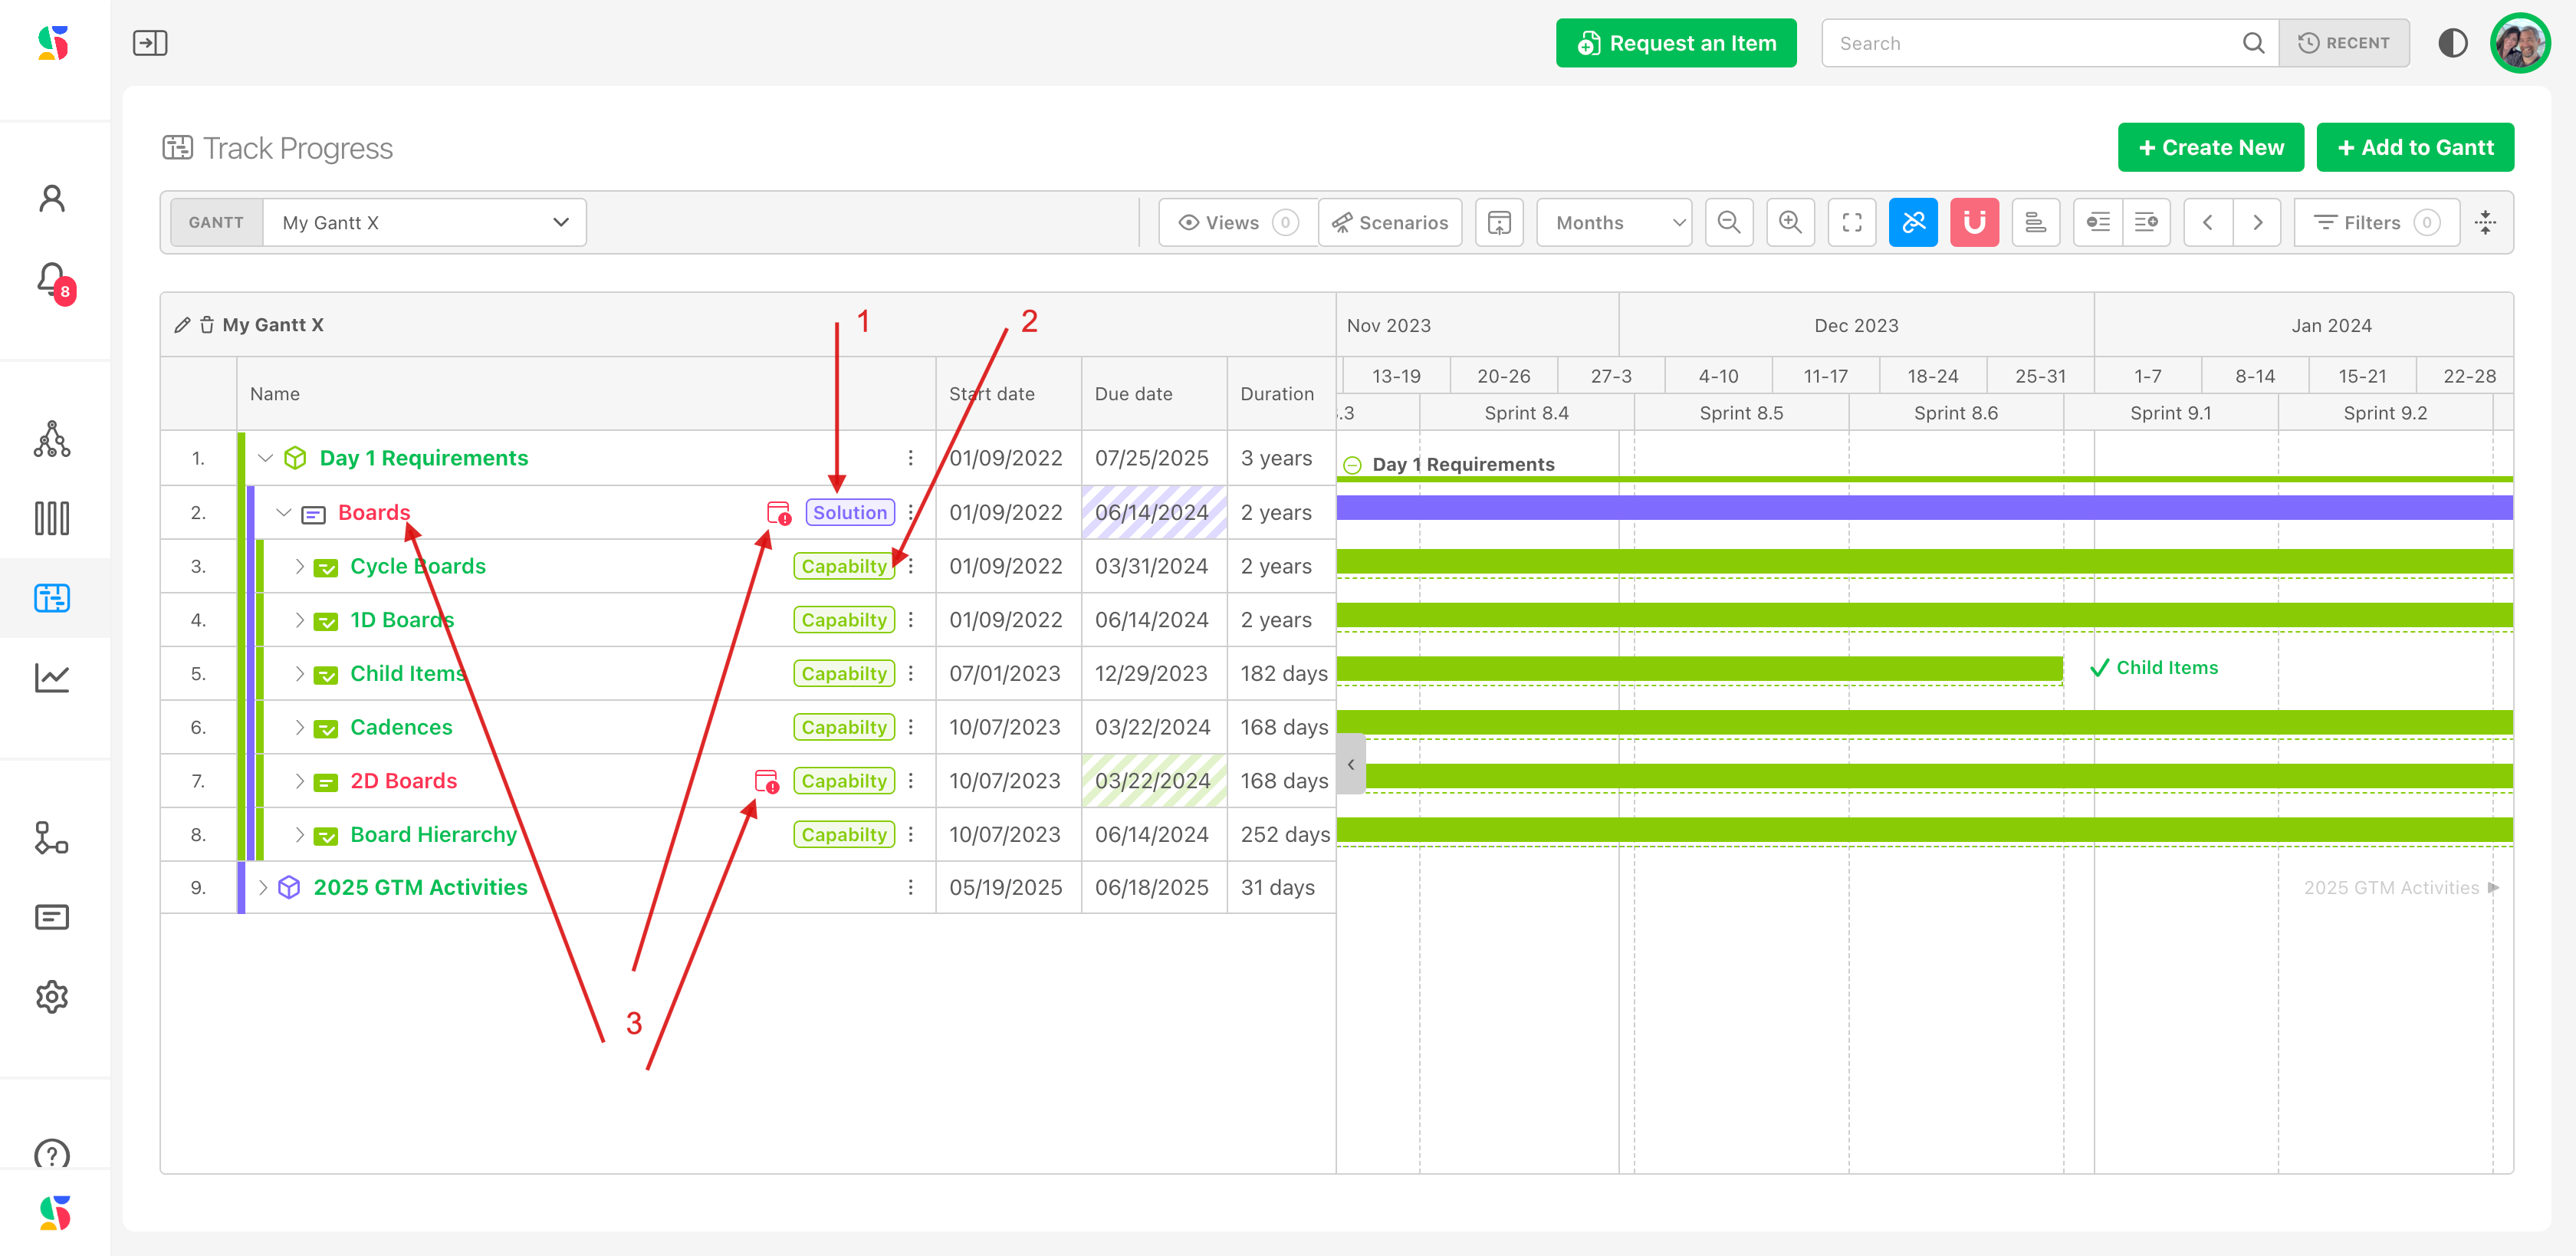
| Red row title | The item is overdue: its due date has passed and it is not done. A calendar icon with a tooltip shows the due date. |
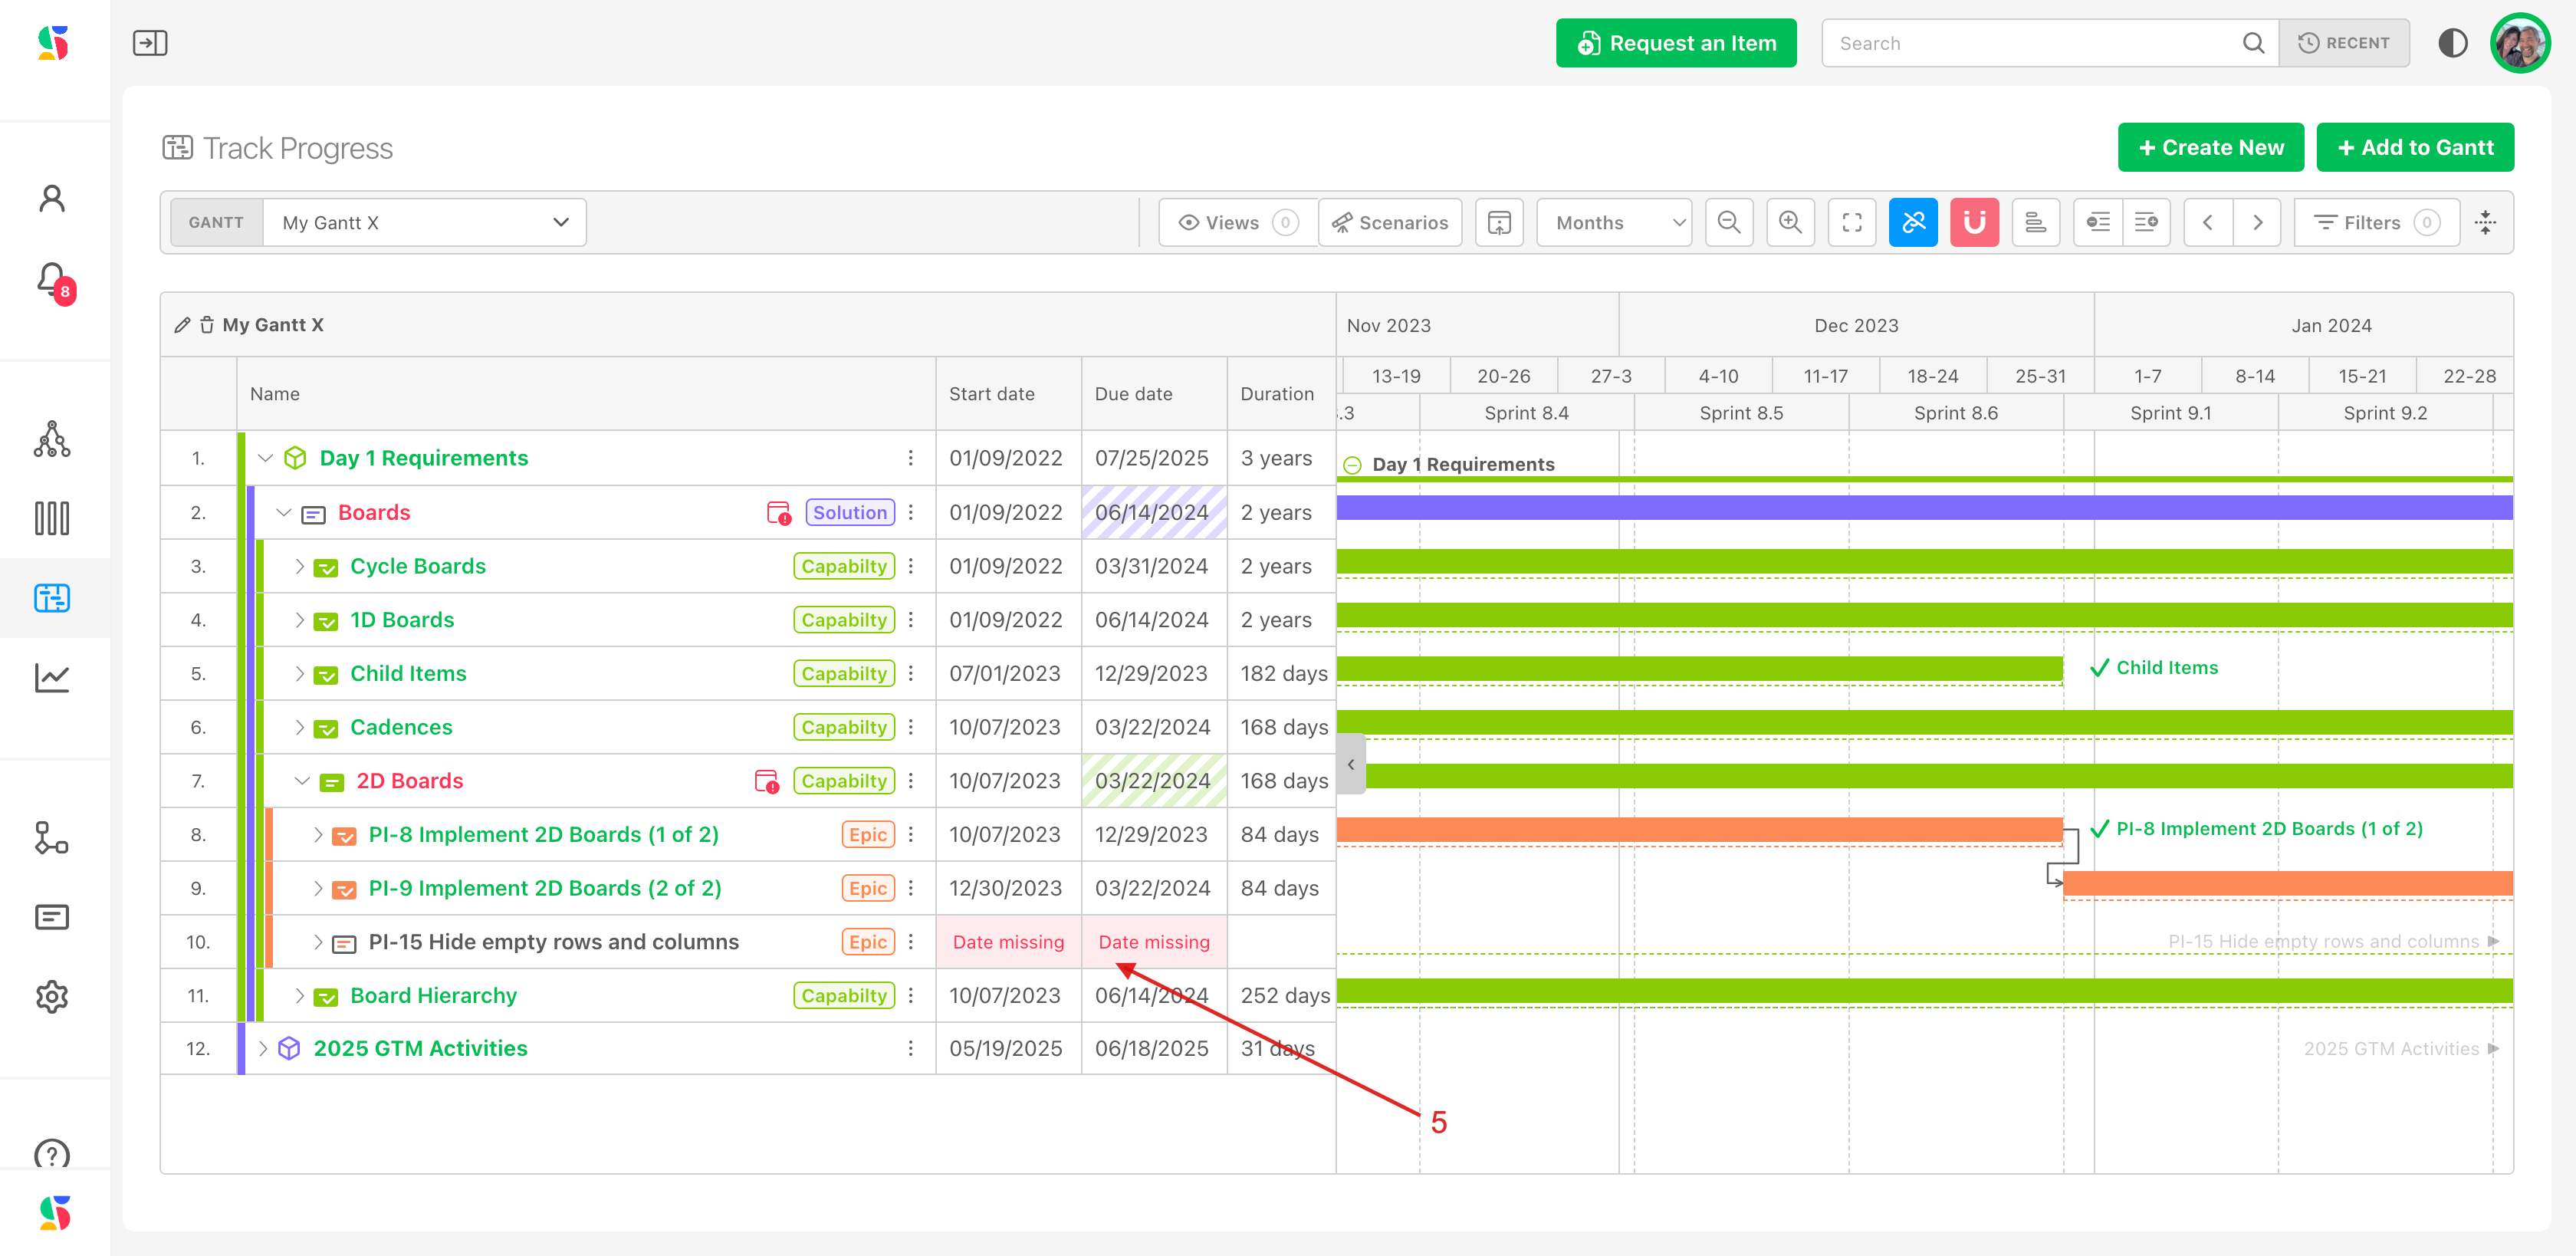
| Date missing in a date cell | The item has no start or due date. A placeholder bar is drawn at an inferred position; click the bar once, or Shift + click the cell, to accept the inferred dates. |
| Lock icon and Restricted in Cycle / Board | The item is on a board you cannot view. |
| Archive icon | The item is archived. Archived items only appear when Include Archived is on. |
| Import icon | The item was brought in by an import or integration. |
| Orange solid line between bars | A Dependency: the arrow points from the blocker's end to the dependent's start. |
| Green dashed line | A Related link with no scheduling meaning. |
| TODAY line | Today's date. Charts open scrolled to it. |
Hover a bar to highlight its row in the table and its dependency lines. Items whose bar is off-screen get a small arrow button at the chart edge labeled with the item name; click it to scroll there.
Summary and detail levels#
The chart loads with initiatives expanded and workstreams collapsed, so a leadership view is one click away and the detail is one click further. Visual indicators roll up: a workstream shows the combined progress of its children, and an overdue child turns its own row red so you can spot trouble before expanding.
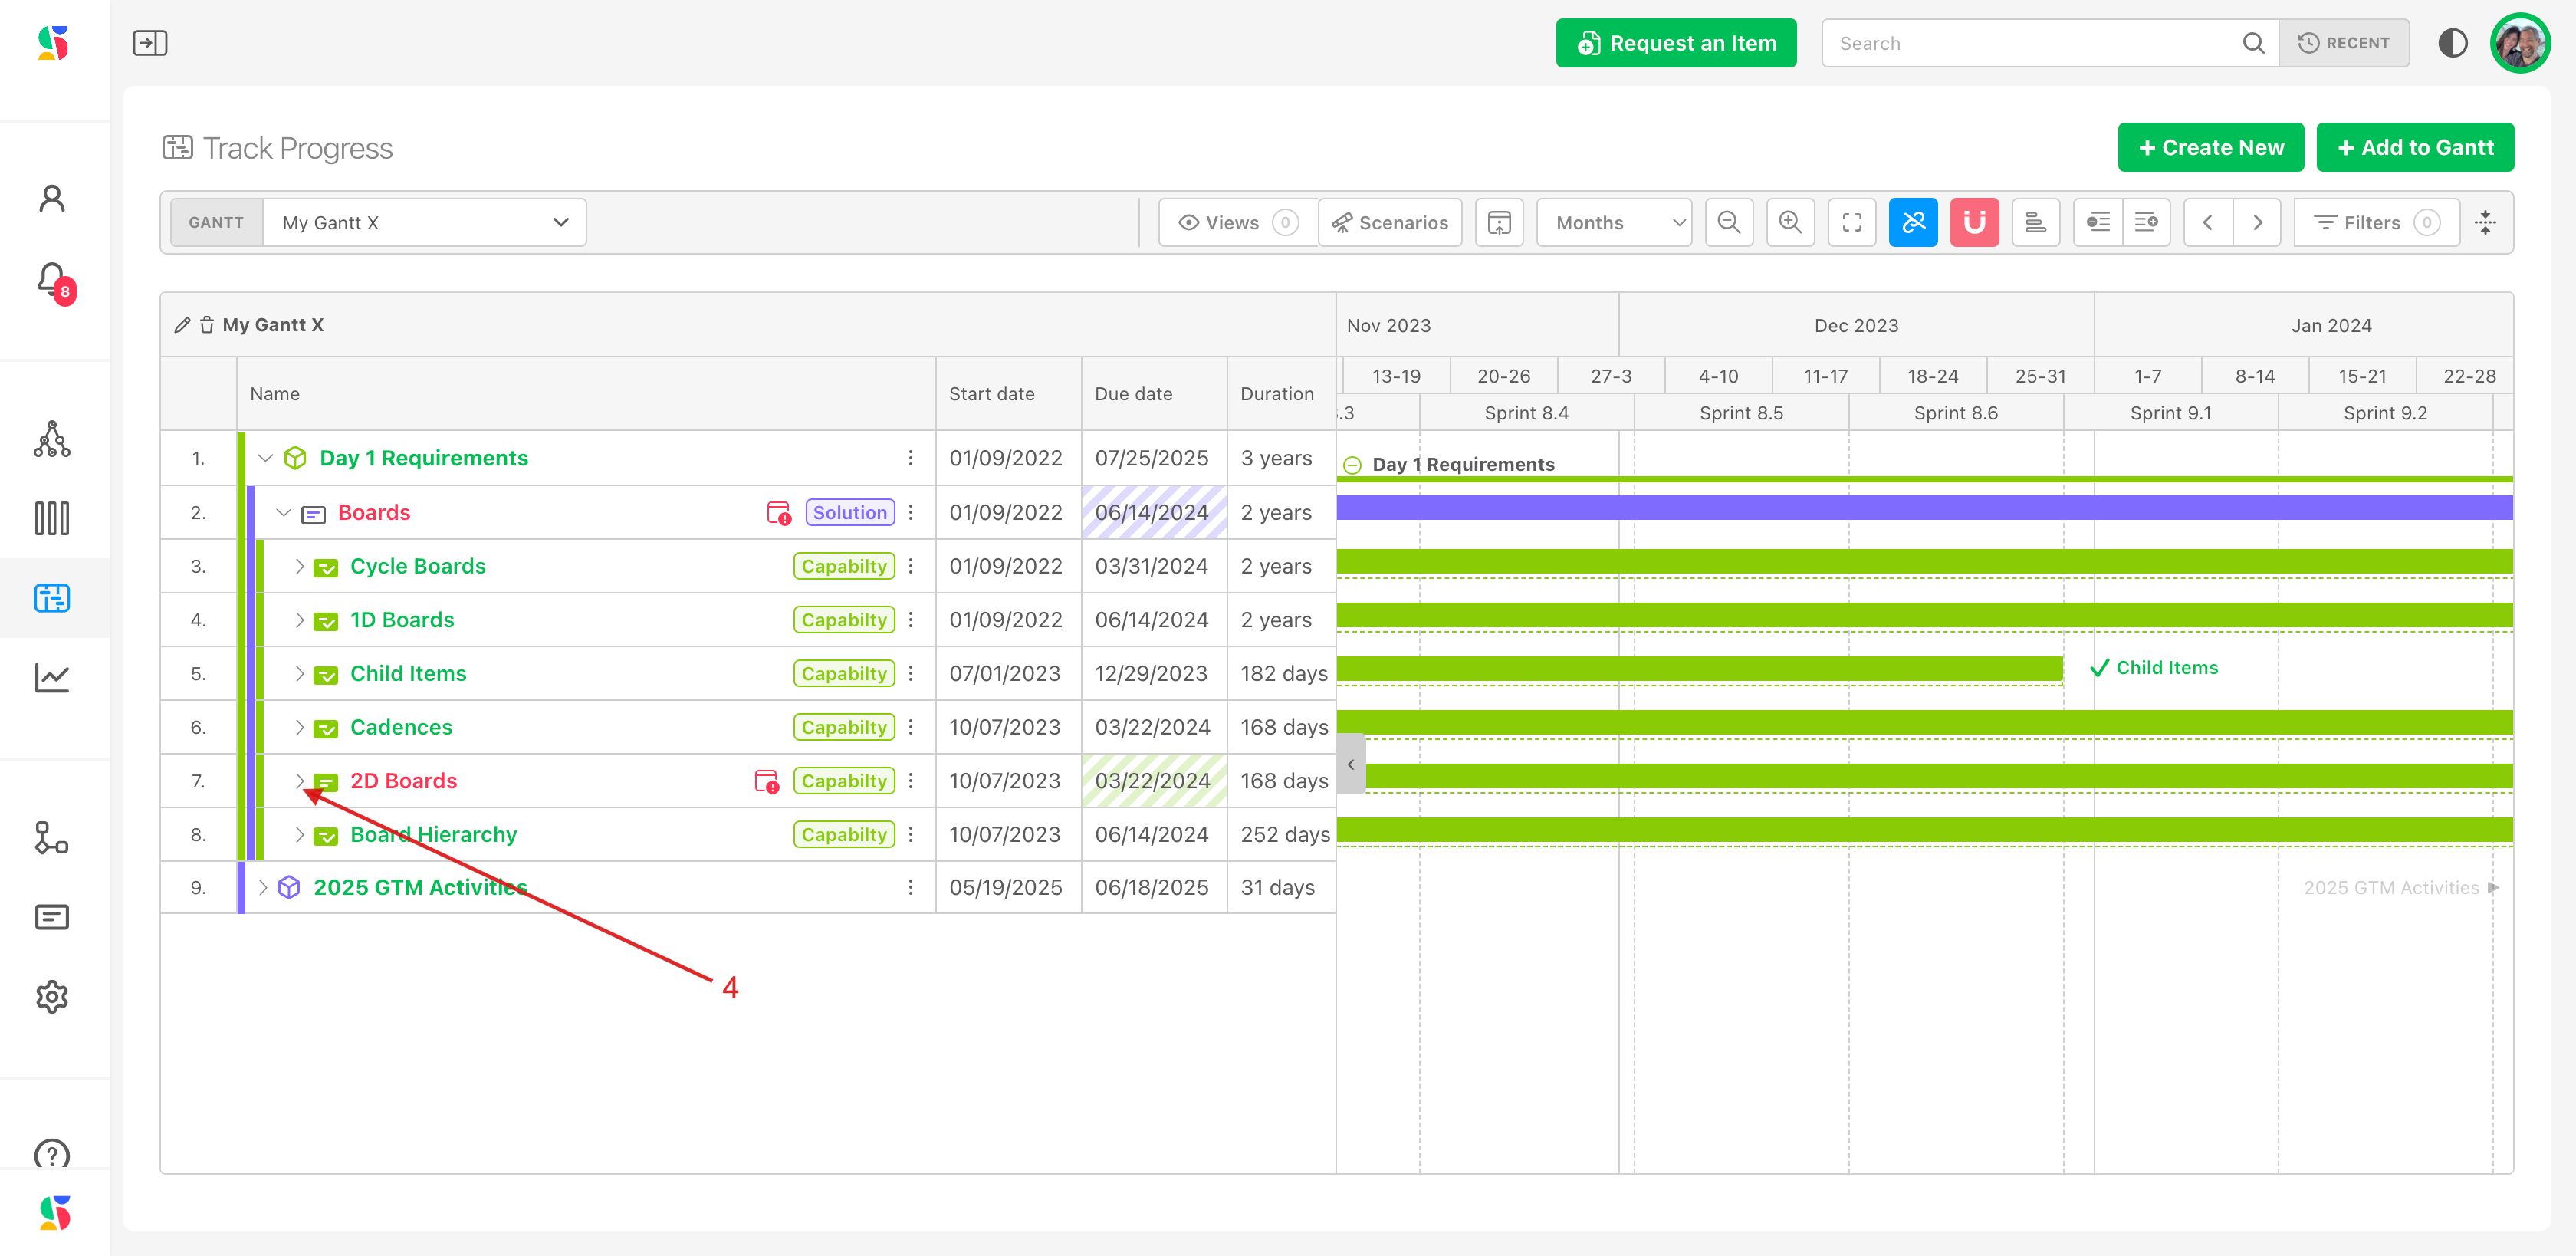
- Click the caret at the left of a row to expand or collapse that row. Children load on demand; the row shows Loading... briefly.
- The two level buttons in the control bar expand or collapse the whole chart one level at a time. Their tooltips tell you exactly what will happen, for example Expand 3 workstreams at level 2. Shift + = expands a level, Shift + - collapses one.
- With a row's Name cell focused, + or = expands it and - collapses it.
- Options on a row, or a right-click, offers Expand children and Collapse children.
Rename the hierarchy, not the chart
The row types you see (solution, capability, epic, story) are your organization's item types. The Gantt shows whatever hierarchy your workstreams already use; it does not have levels of its own beyond initiative and milestone.
Filter to the work you care about#
Click Filters in the filter bar. A chart often holds several teams' work; a filter shows one slice without changing the chart for anyone else.
| Filter | Narrows to |
|---|---|
| Assignee, Persona | Who the items are assigned to (Persona appears when personas are enabled) |
| Team | Items on the selected teams' boards |
| Board, Cycle | Items on specific boards, or within a range of cycles |
| Status | Workflow status |
| Item Type | Your item types |
| Priority, Tag, Field | Priority, tags, and custom field values |
| Parent | Items under a chosen parent |
| Start Date, Due Date, Completion Date | Date ranges |
| Time Spent | Logged time thresholds |
| Creator, Watchers | Who created or watches the item |
| Include Archived | Also show archived items |
| Advanced Filters | Build a query combining fields |
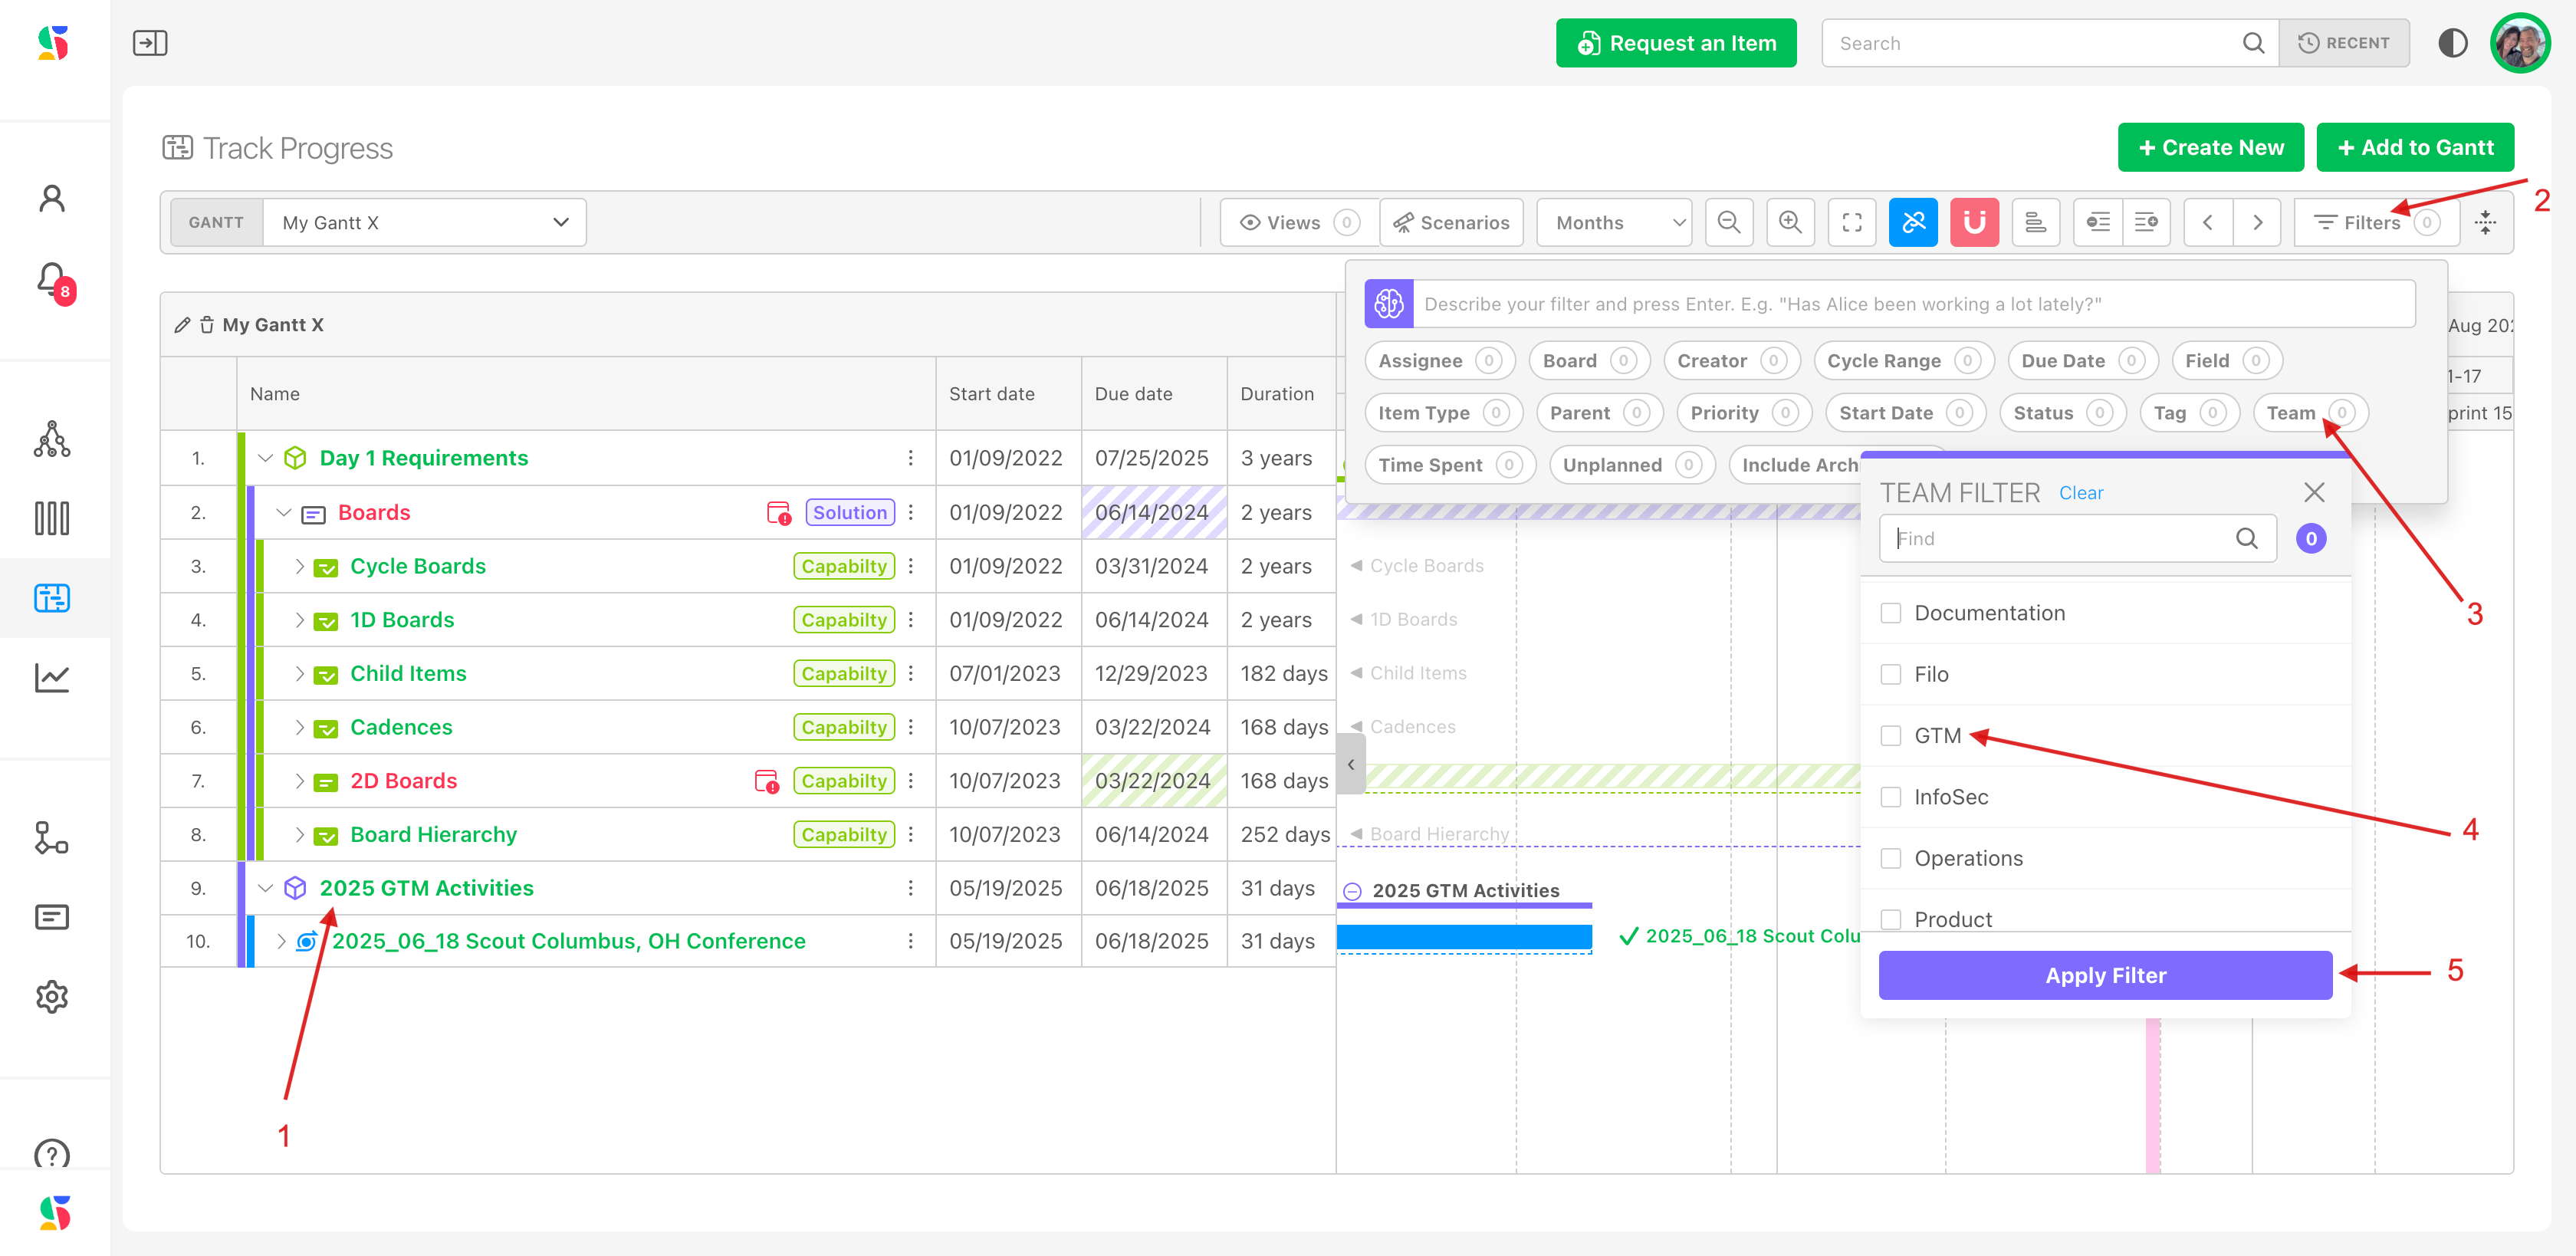
Initiatives and milestones always stay; filters apply to the workstreams and items beneath them. Clear a single filter by clicking its pill and deselecting values, or remove them all with the x on the filter bar.
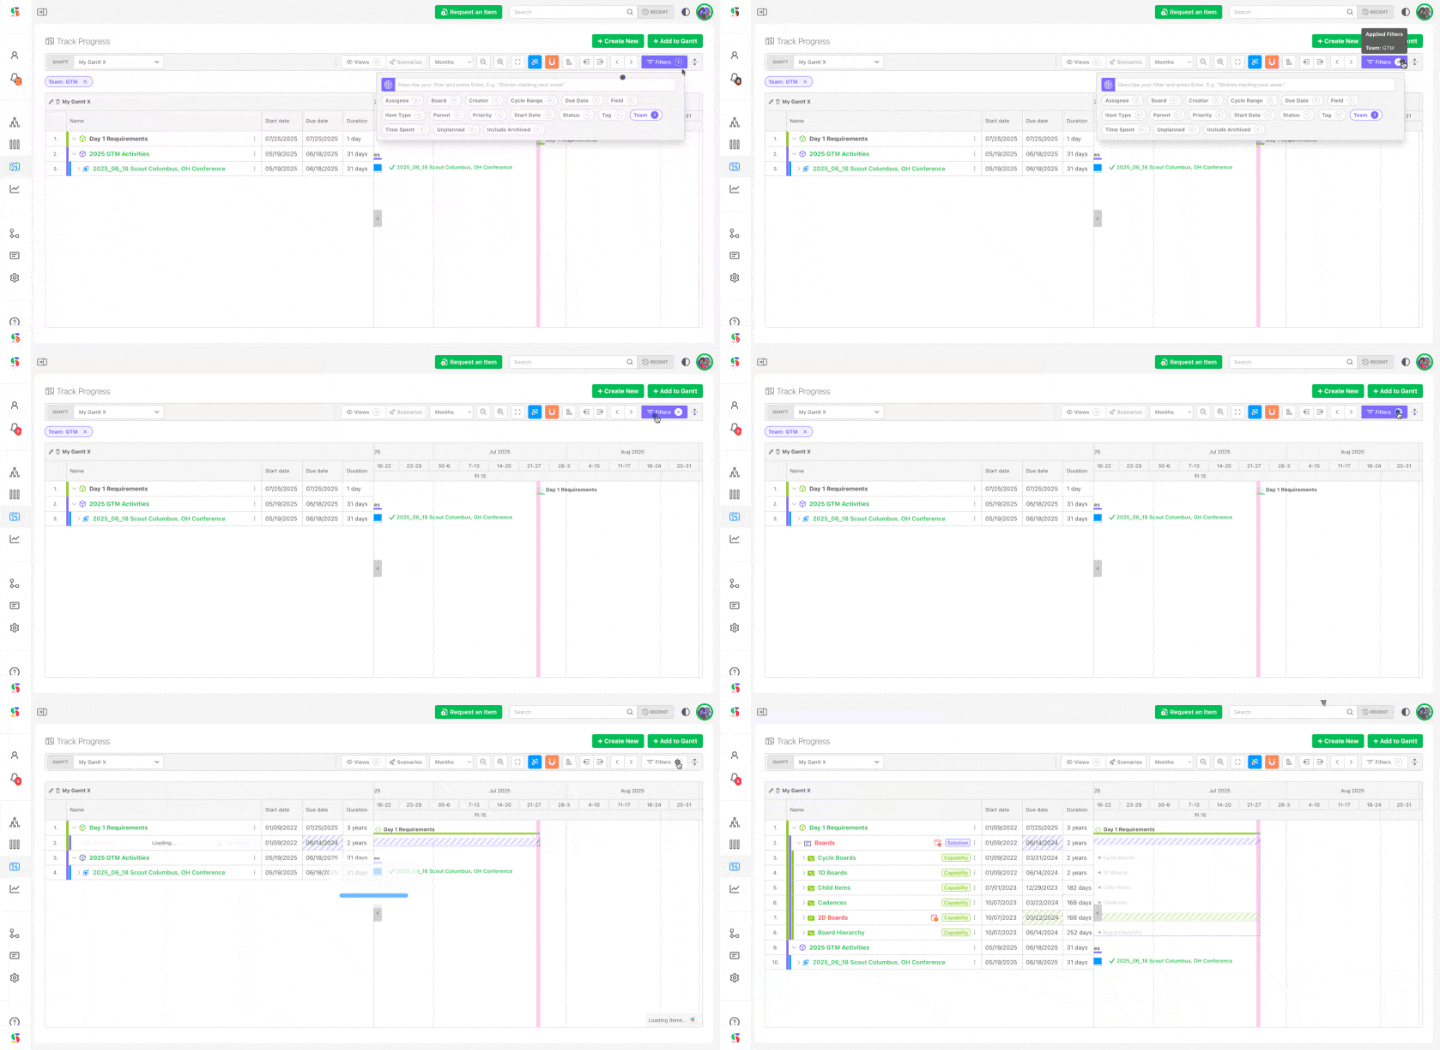
Filters pause scenarios
The Scenarios control is disabled while any filter is applied, because a scenario snapshot has to cover the whole chart. Clear filters before recording or comparing a scenario.
Look through any team's cadence#
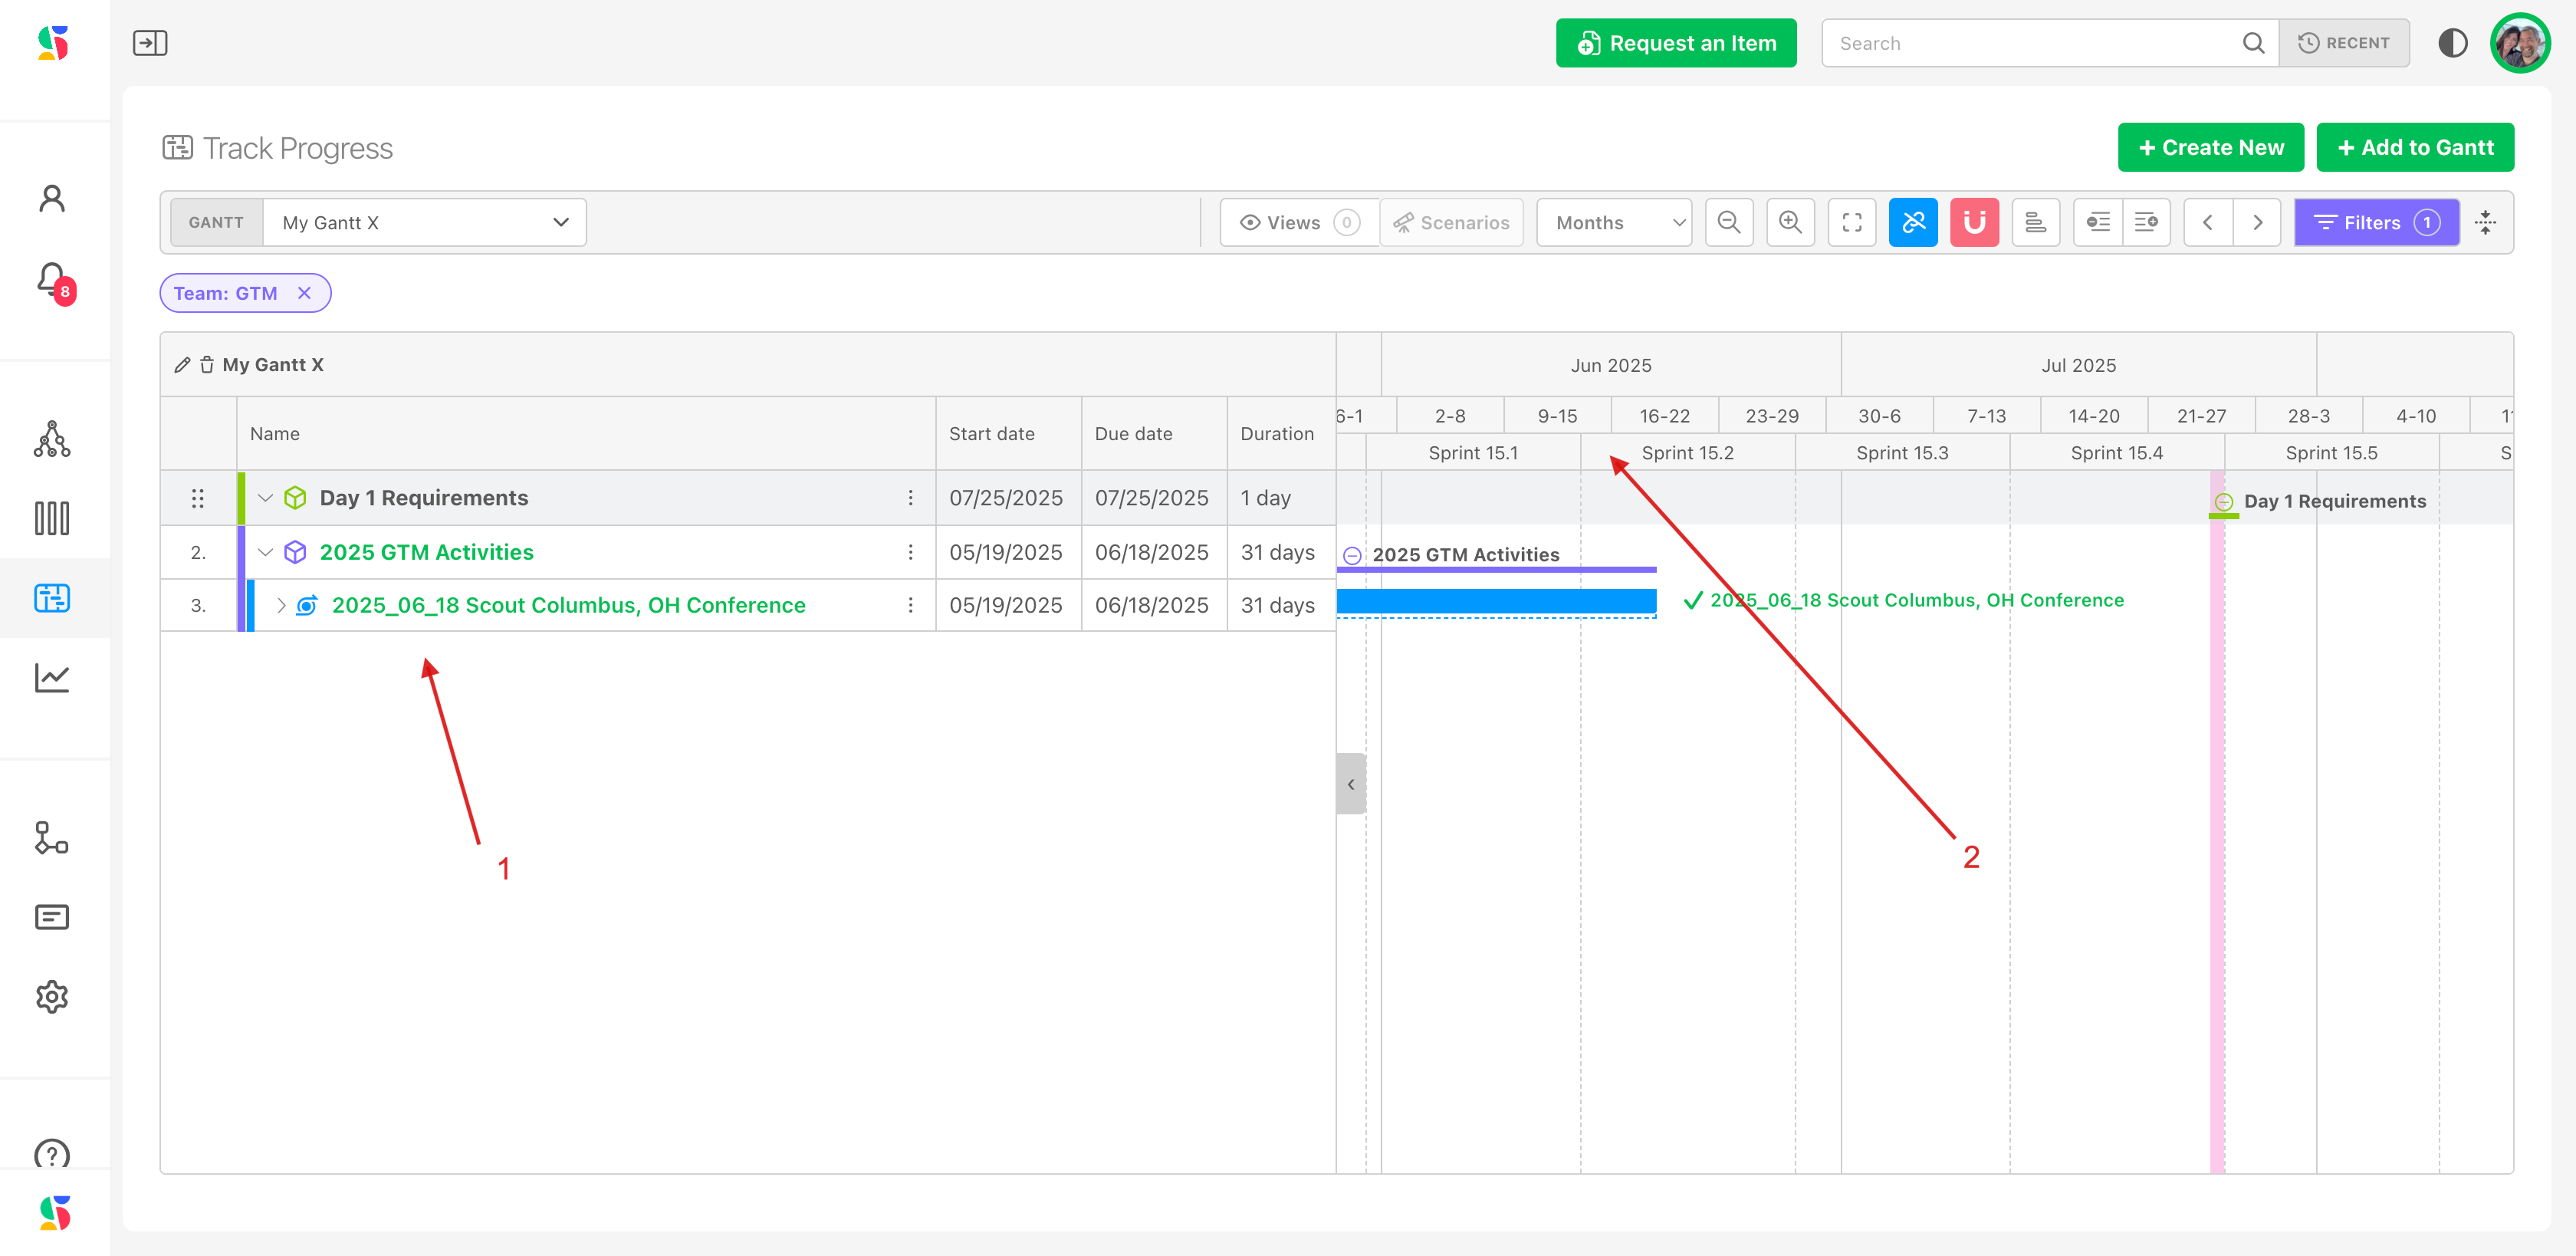
Snap to cycles (magnet) overlays one board folder's cycles as bands behind the bars. It is a lens, not a filter: the bars do not change, but you can see which sprint or program increment each piece of work lands in.
In the example, the chart is filtered to the GTM team's activities (1), but the bands still show the WebDev team's sprints (2). That is useful on purpose: GTM can see which engineering sprint their work depends on.
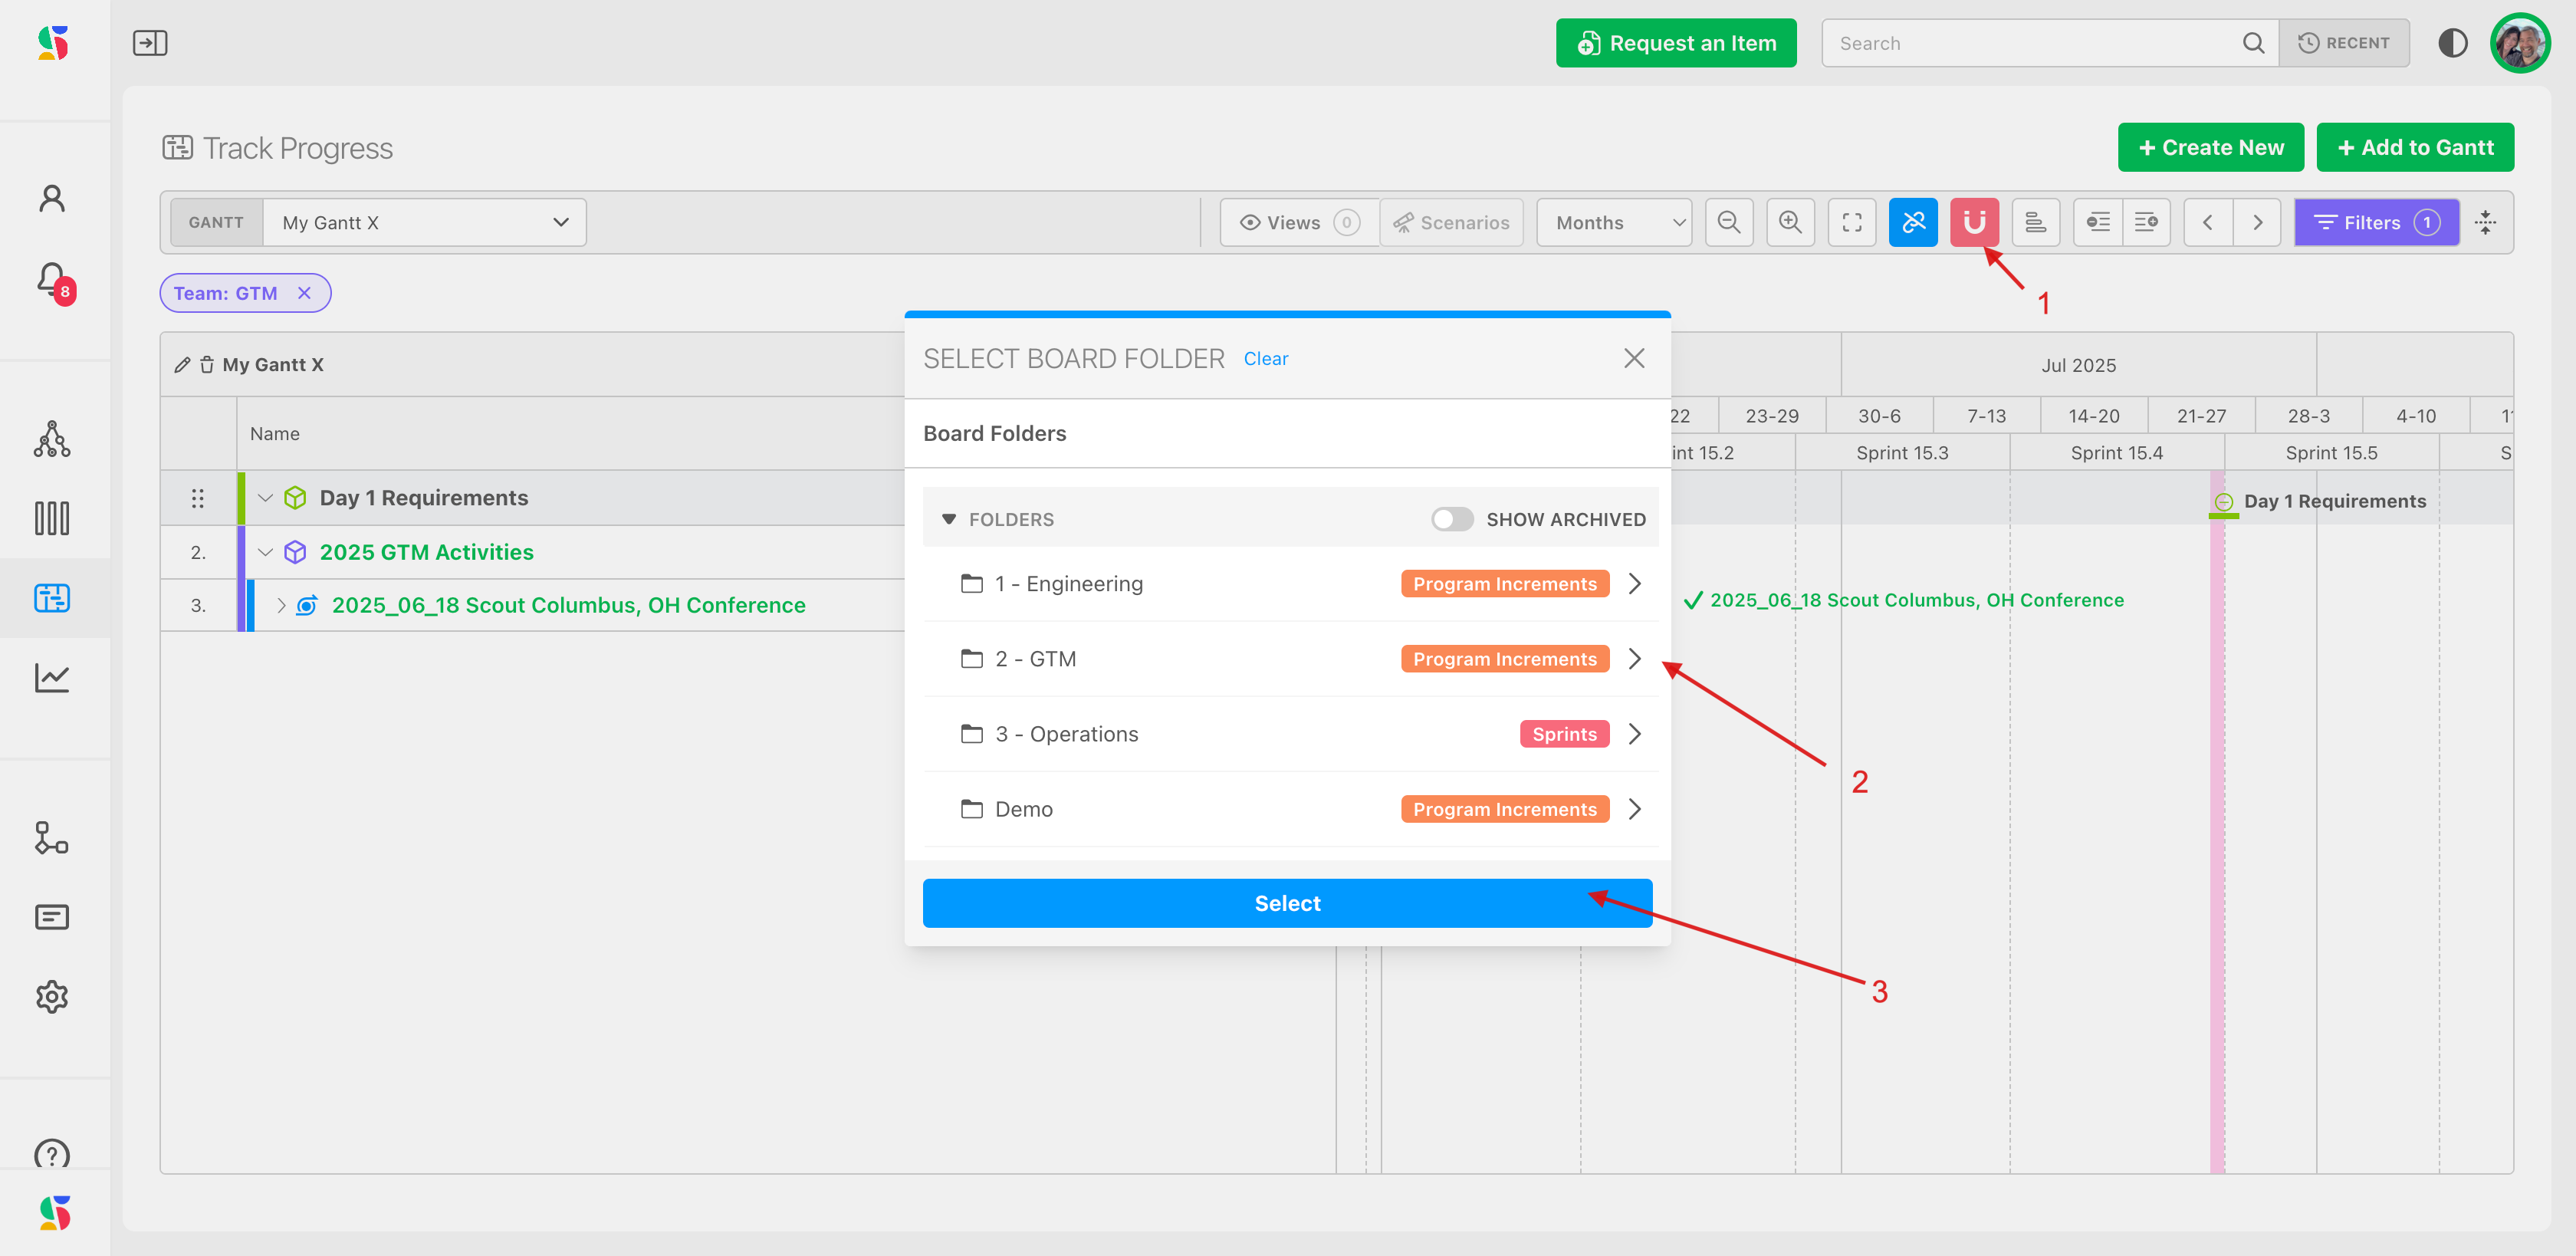
To switch lenses, click the magnet, expand to a different folder (here the GTM program increment folder) and click Select.
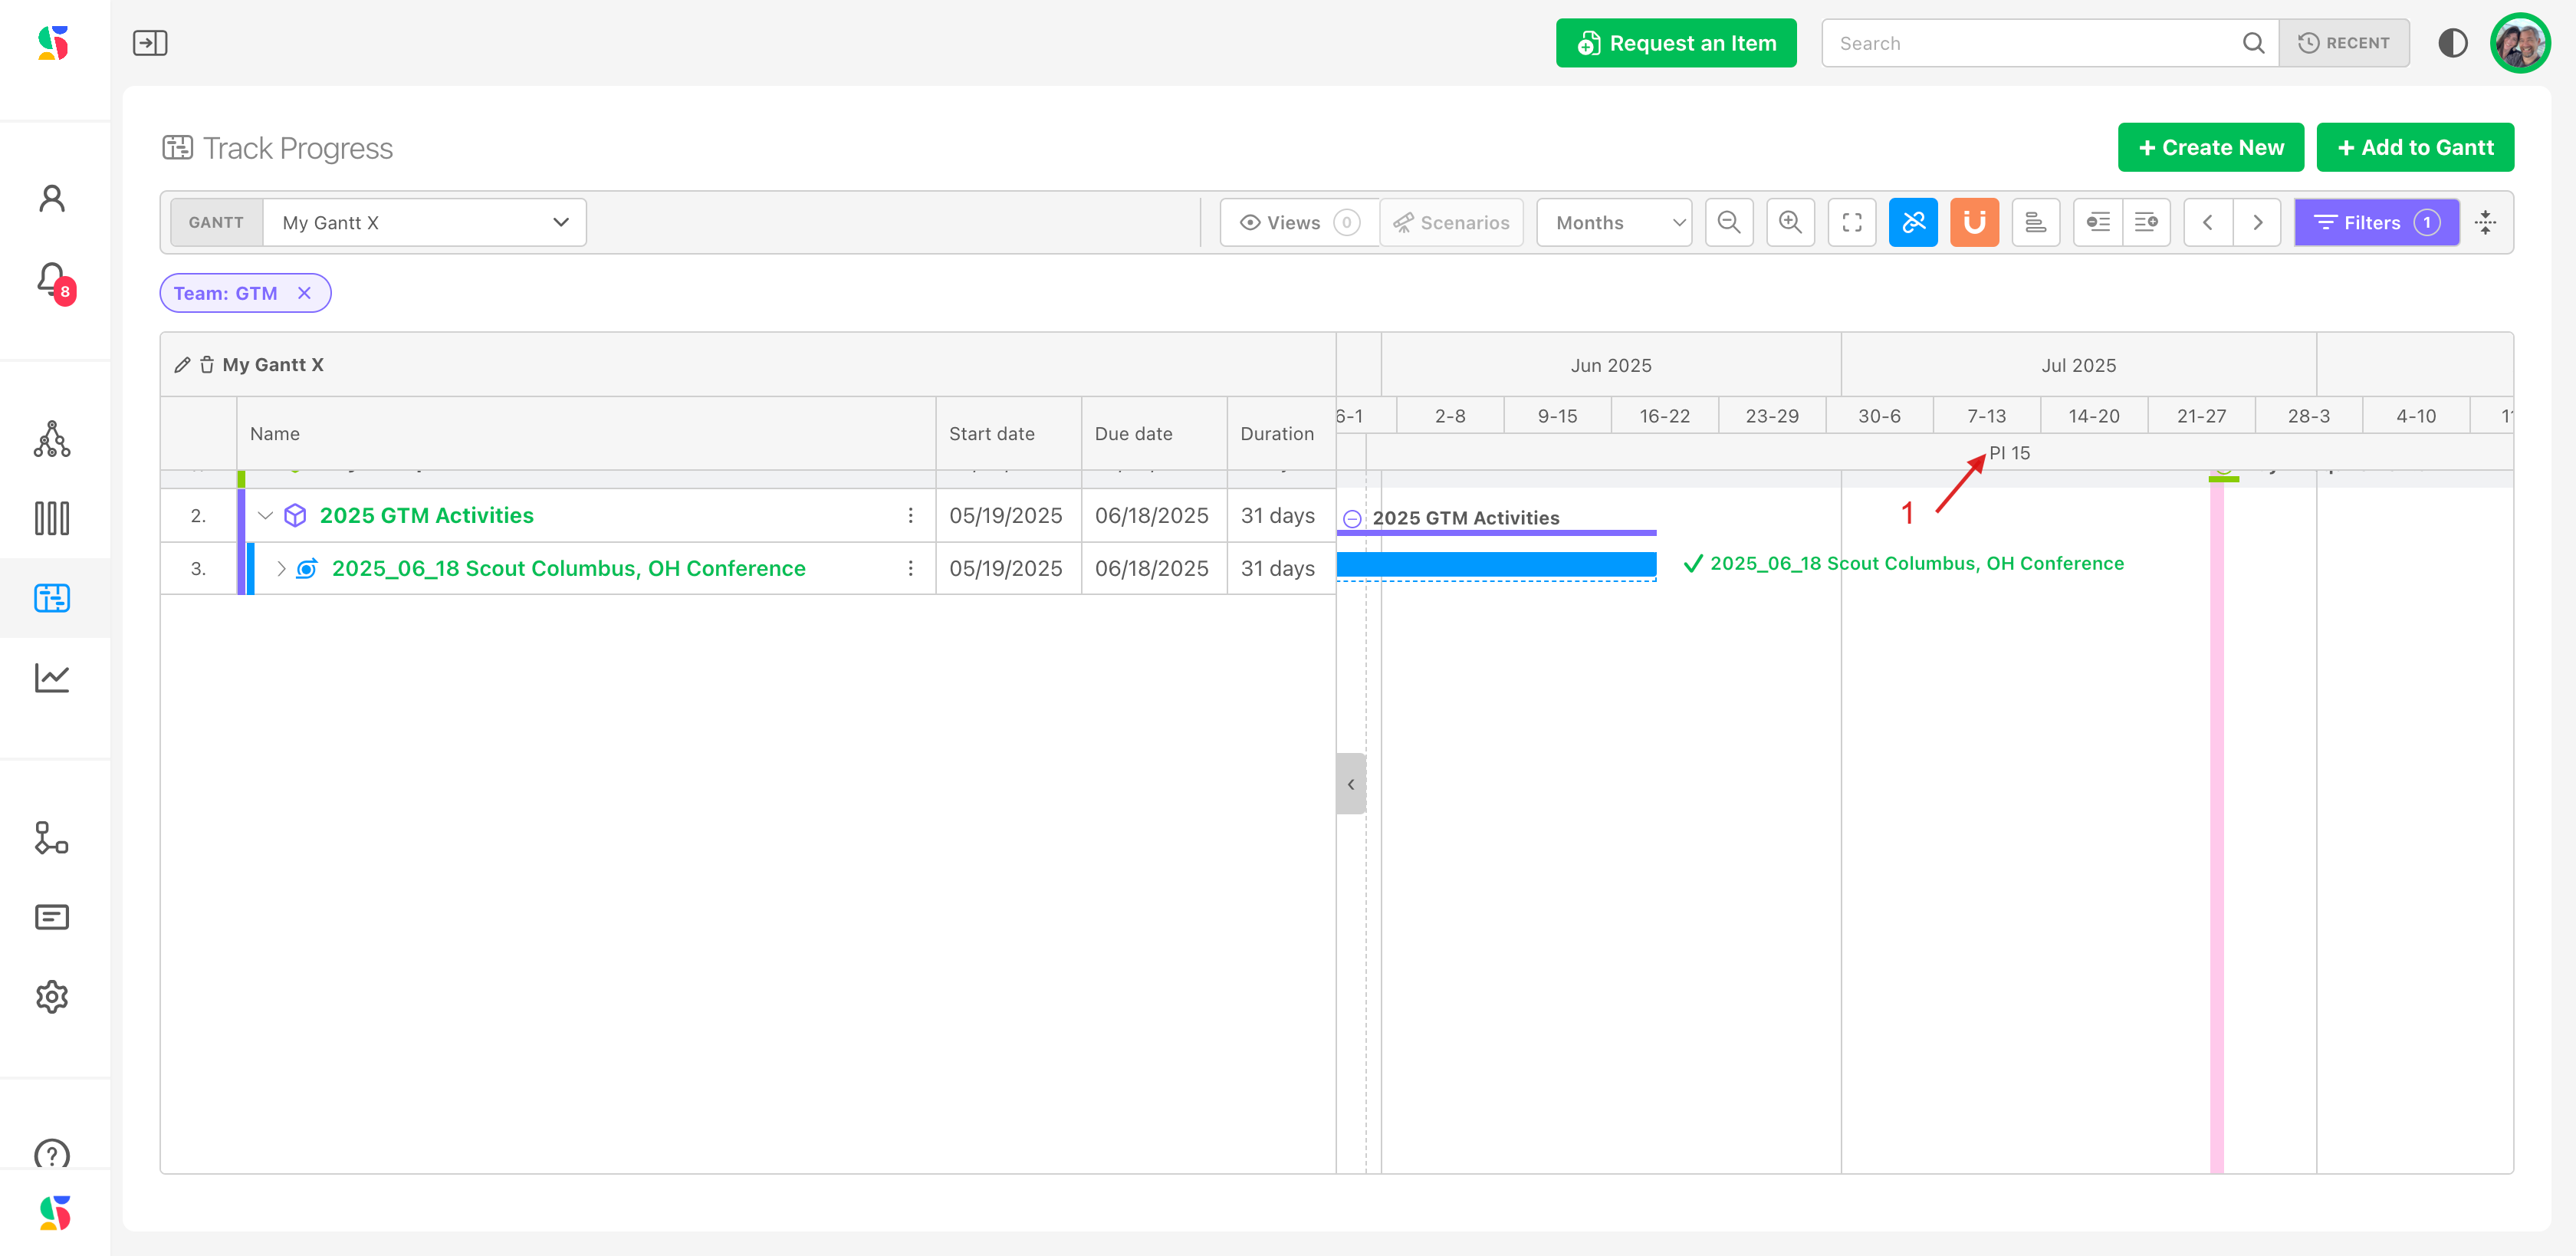
Clear the lens with the clear control in the same dialog. While a lens is on, dragging a work item is constrained to a single cycle and re-assigns its board; see Navigating the timeline.
Options panel#
Options in the filter bar holds five view toggles and the Table columns button. The toggles are remembered in your browser for every chart.
| Toggle | Effect |
|---|---|
| Hide Bounding Boxes | Removes the initiative and parent boxes around grouped bars |
| Hide Inline Labels | Removes the text drawn on bars |
| Hide Relationships | Removes dependency and related lines |
| Show Item Numbers | Shows each item's number before its title in the Name column |
| Sort by Start Date | Lists rows earliest first at every level instead of in their saved order. A row sorts by its own start date or the earliest start under it, else its due date; rows with no dates come last. This changes only the view: the saved order is untouched, and rows cannot be dragged into a new order while it is on (bars can still be moved). A filter-bar chip, Sorted by start date, shows it is on and clears it. |
Table columns opens the Manage Columns picker, the same one the Items Table uses: show, hide and reorder the table's columns, including Items Table columns such as Assignee, Status, Priority, Tags, Team and your custom fields, which start hidden. See Choose columns.
Save and share a view#
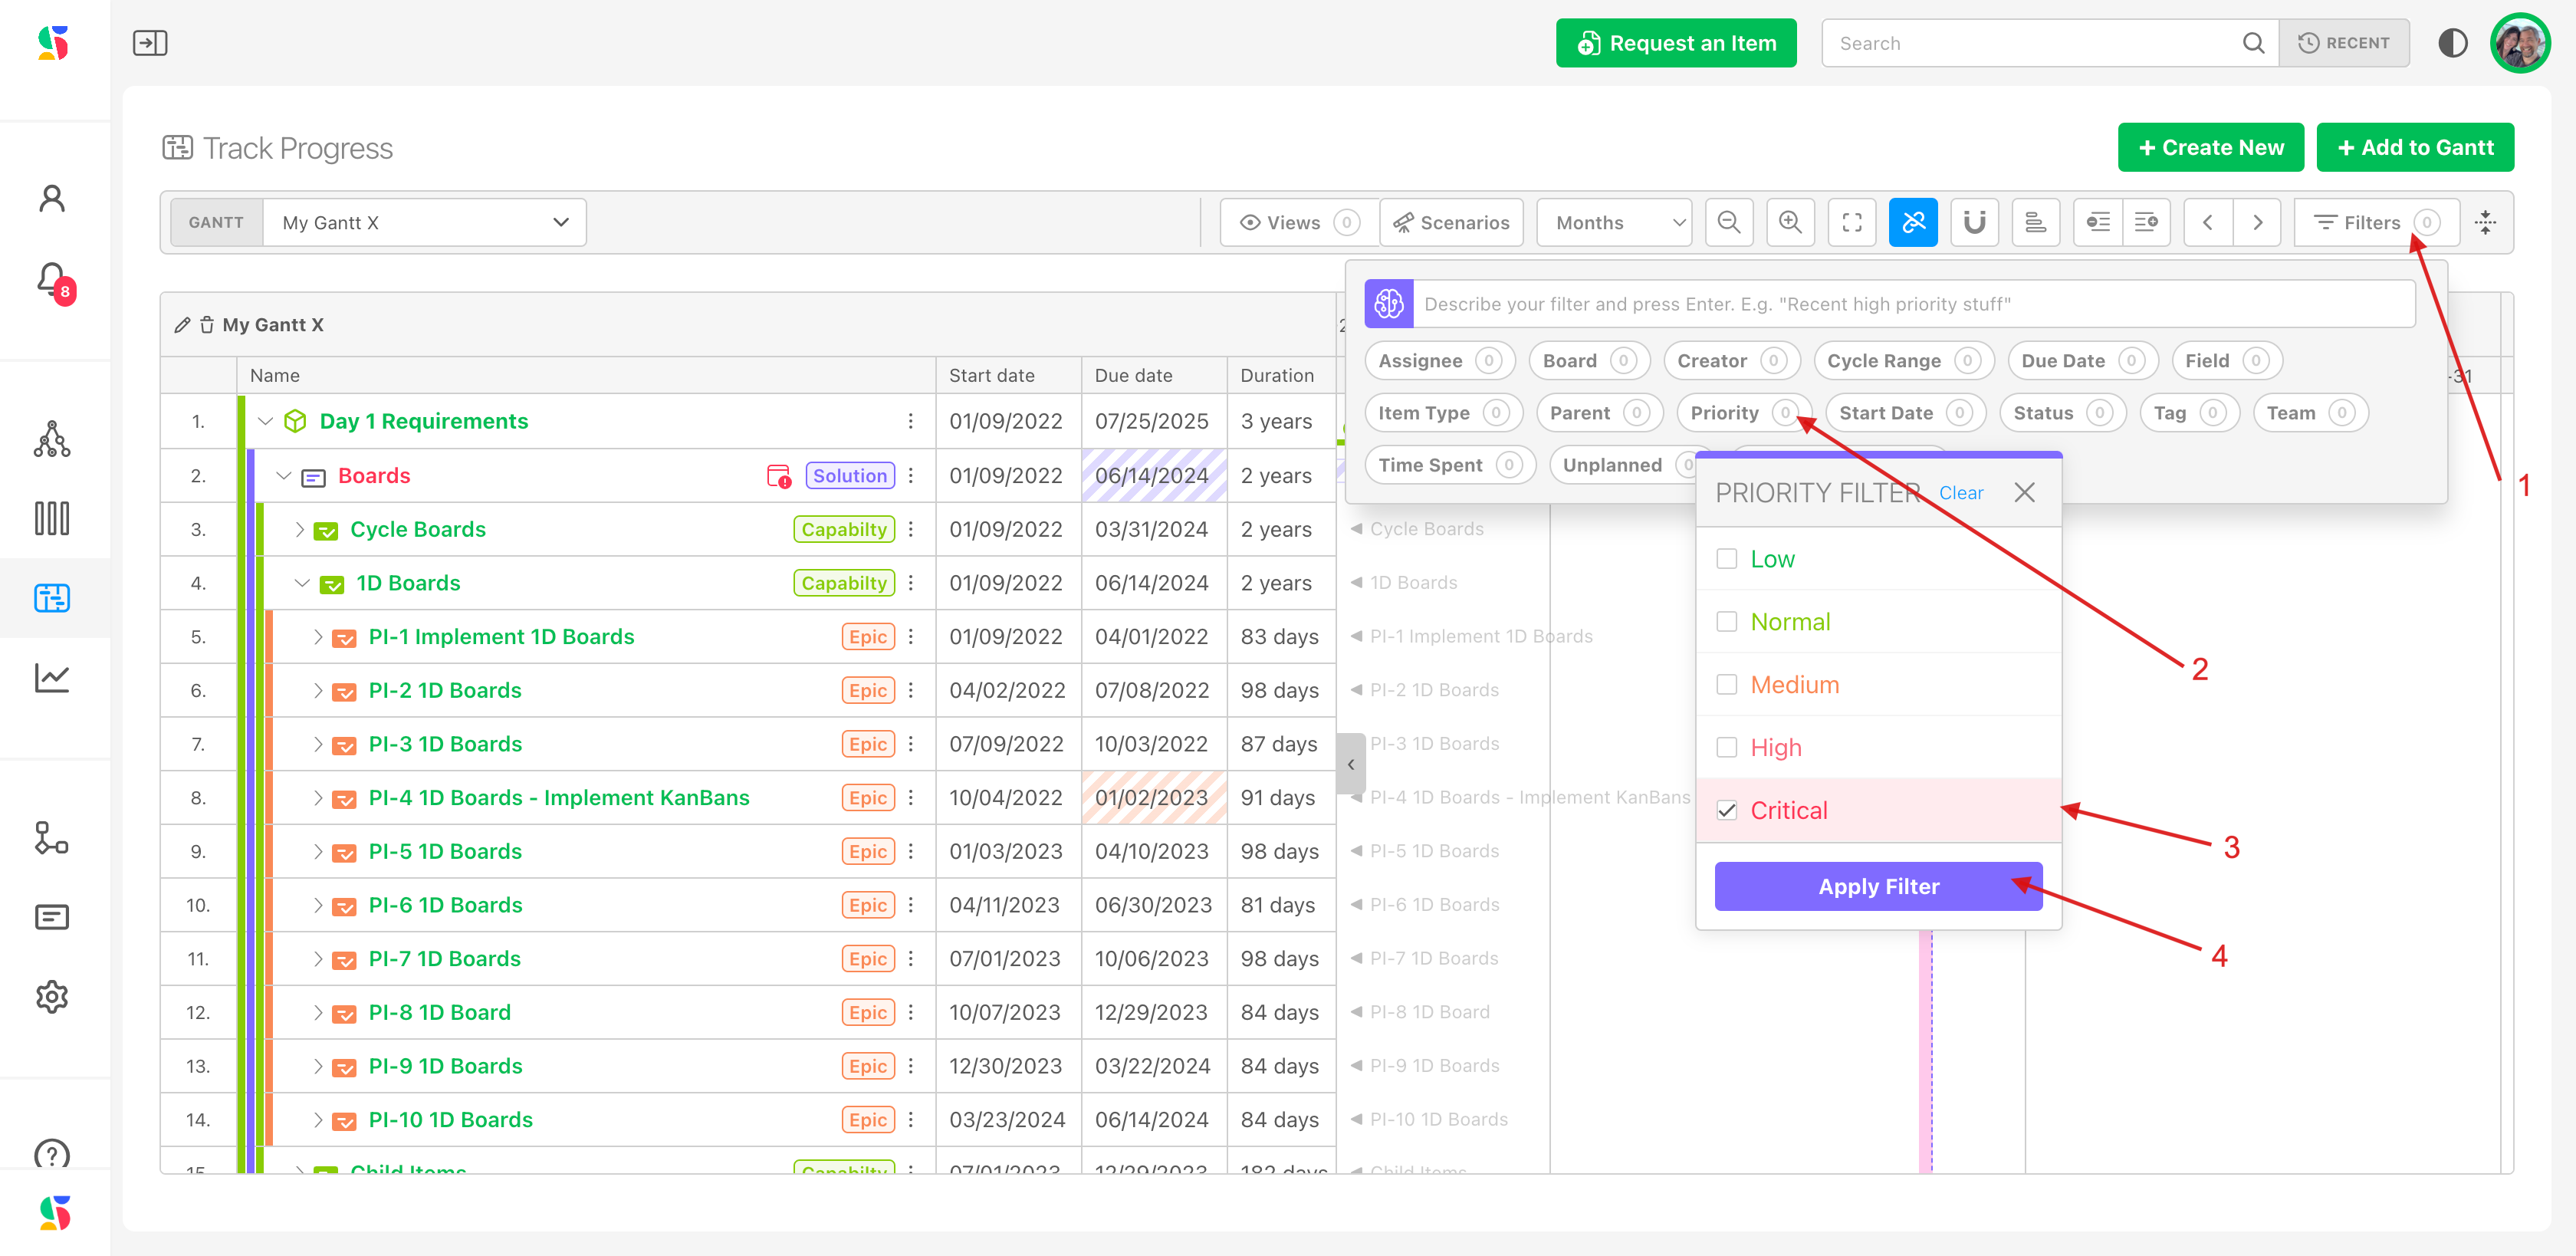
A saved view captures the whole state of the chart so stakeholders open the same picture every time. Here is a view that shows only critical-priority work.
- Click Filters, choose Priority, select Critical, and apply.
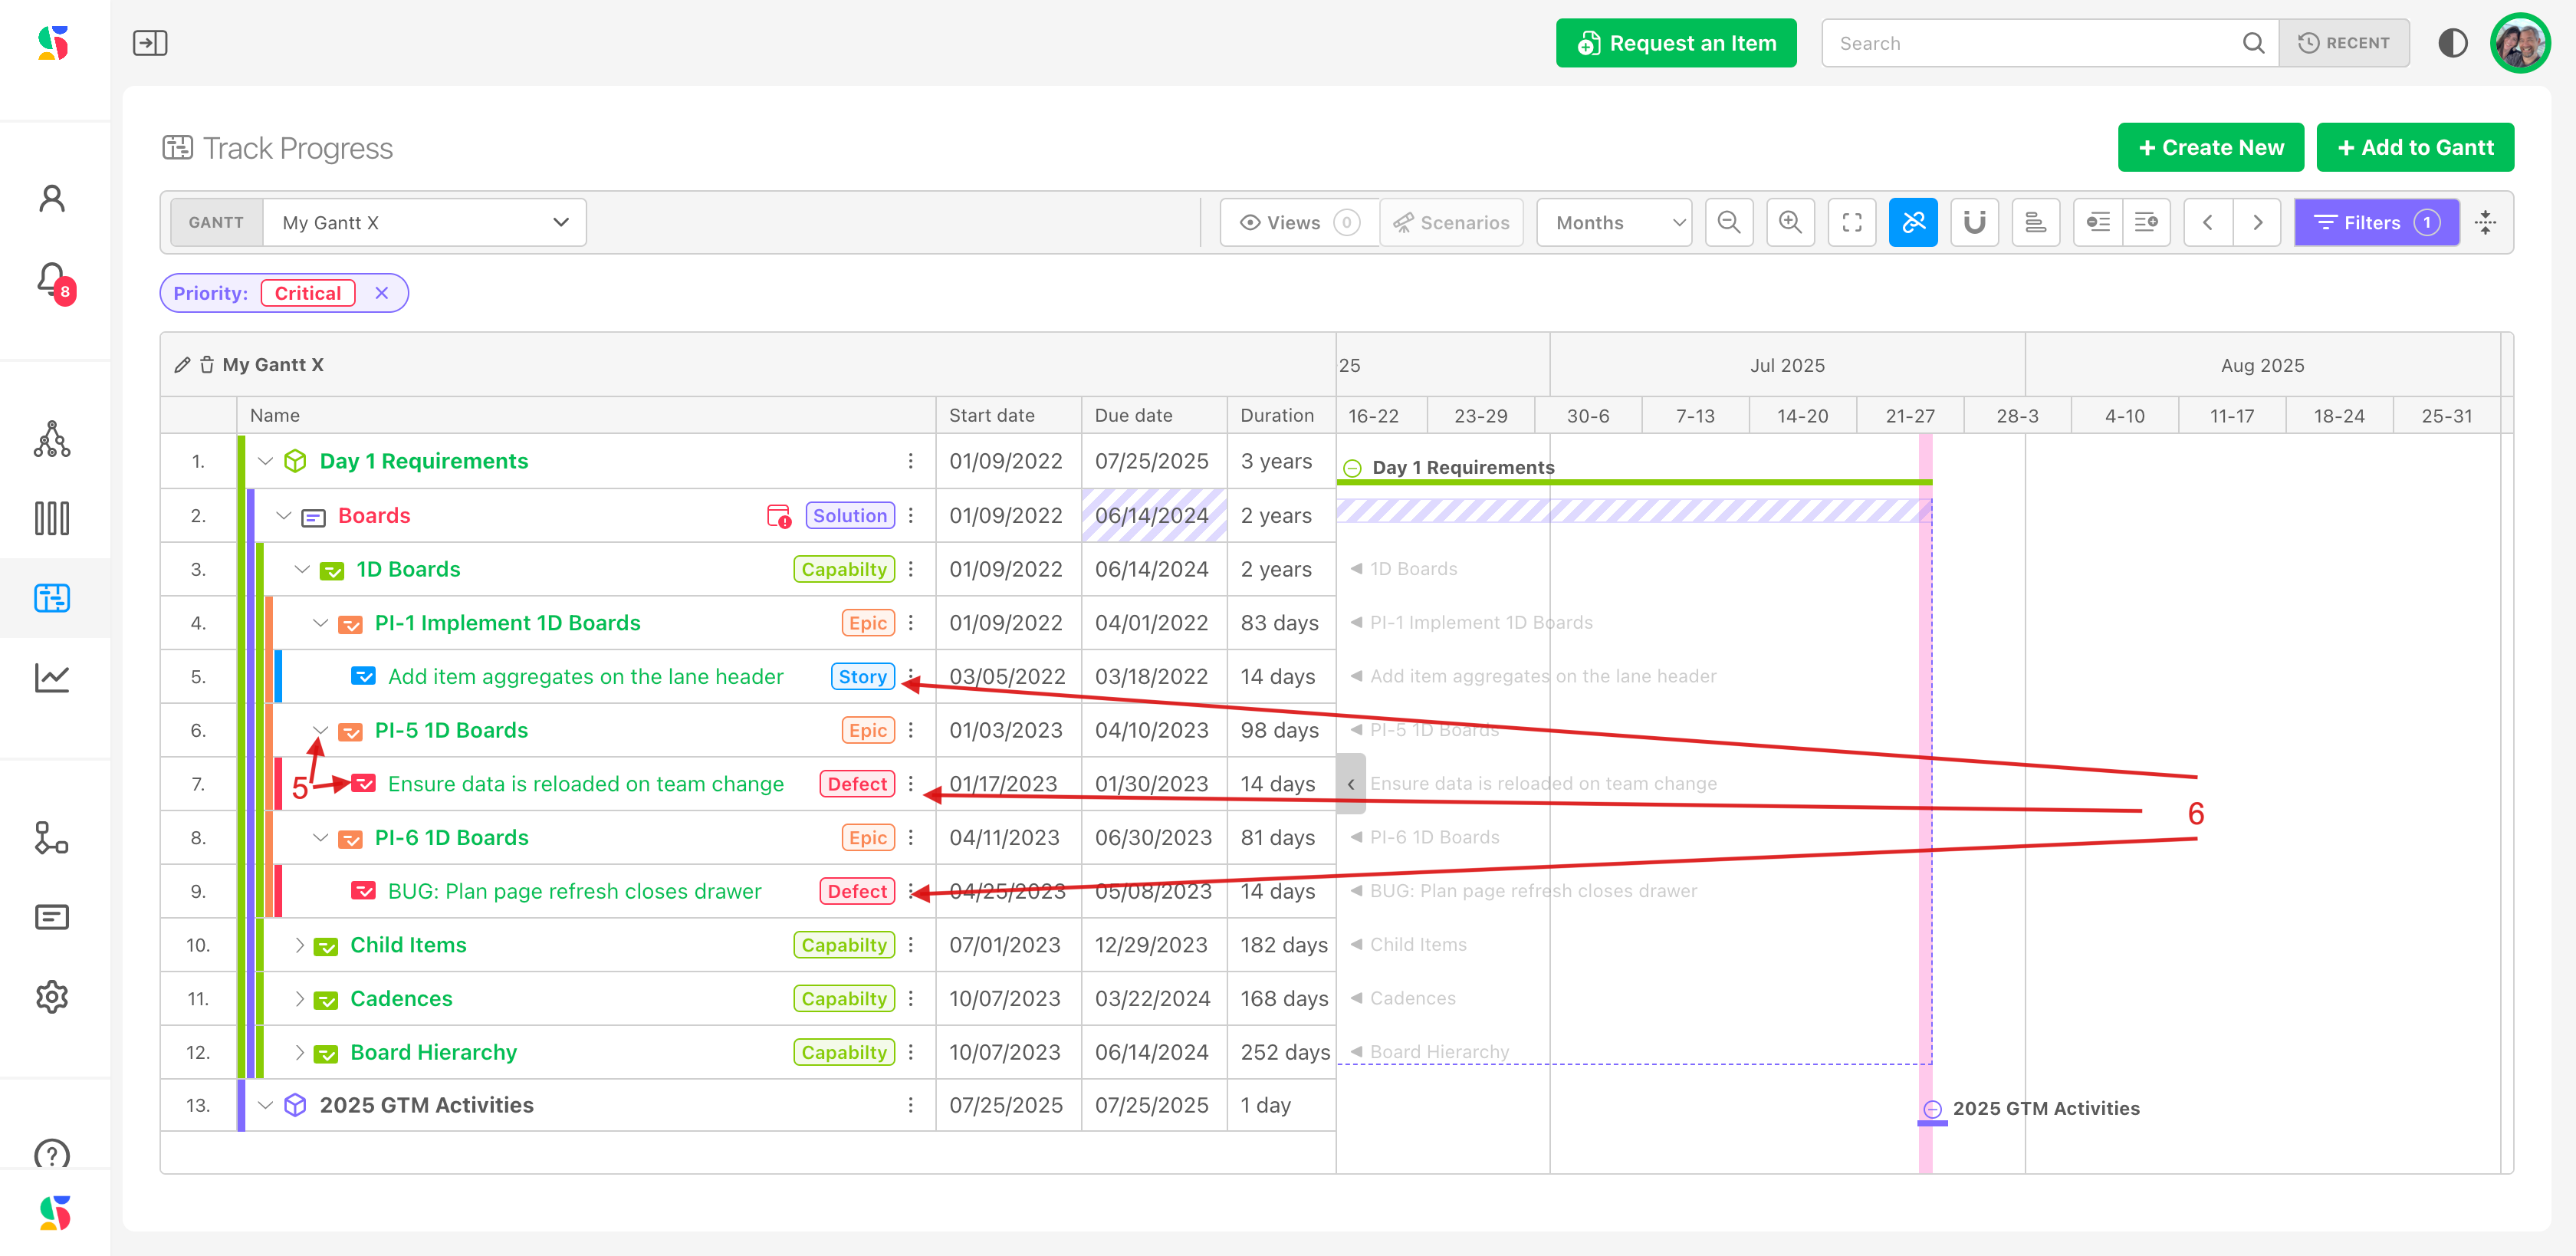
- Expand the rows you want visible.
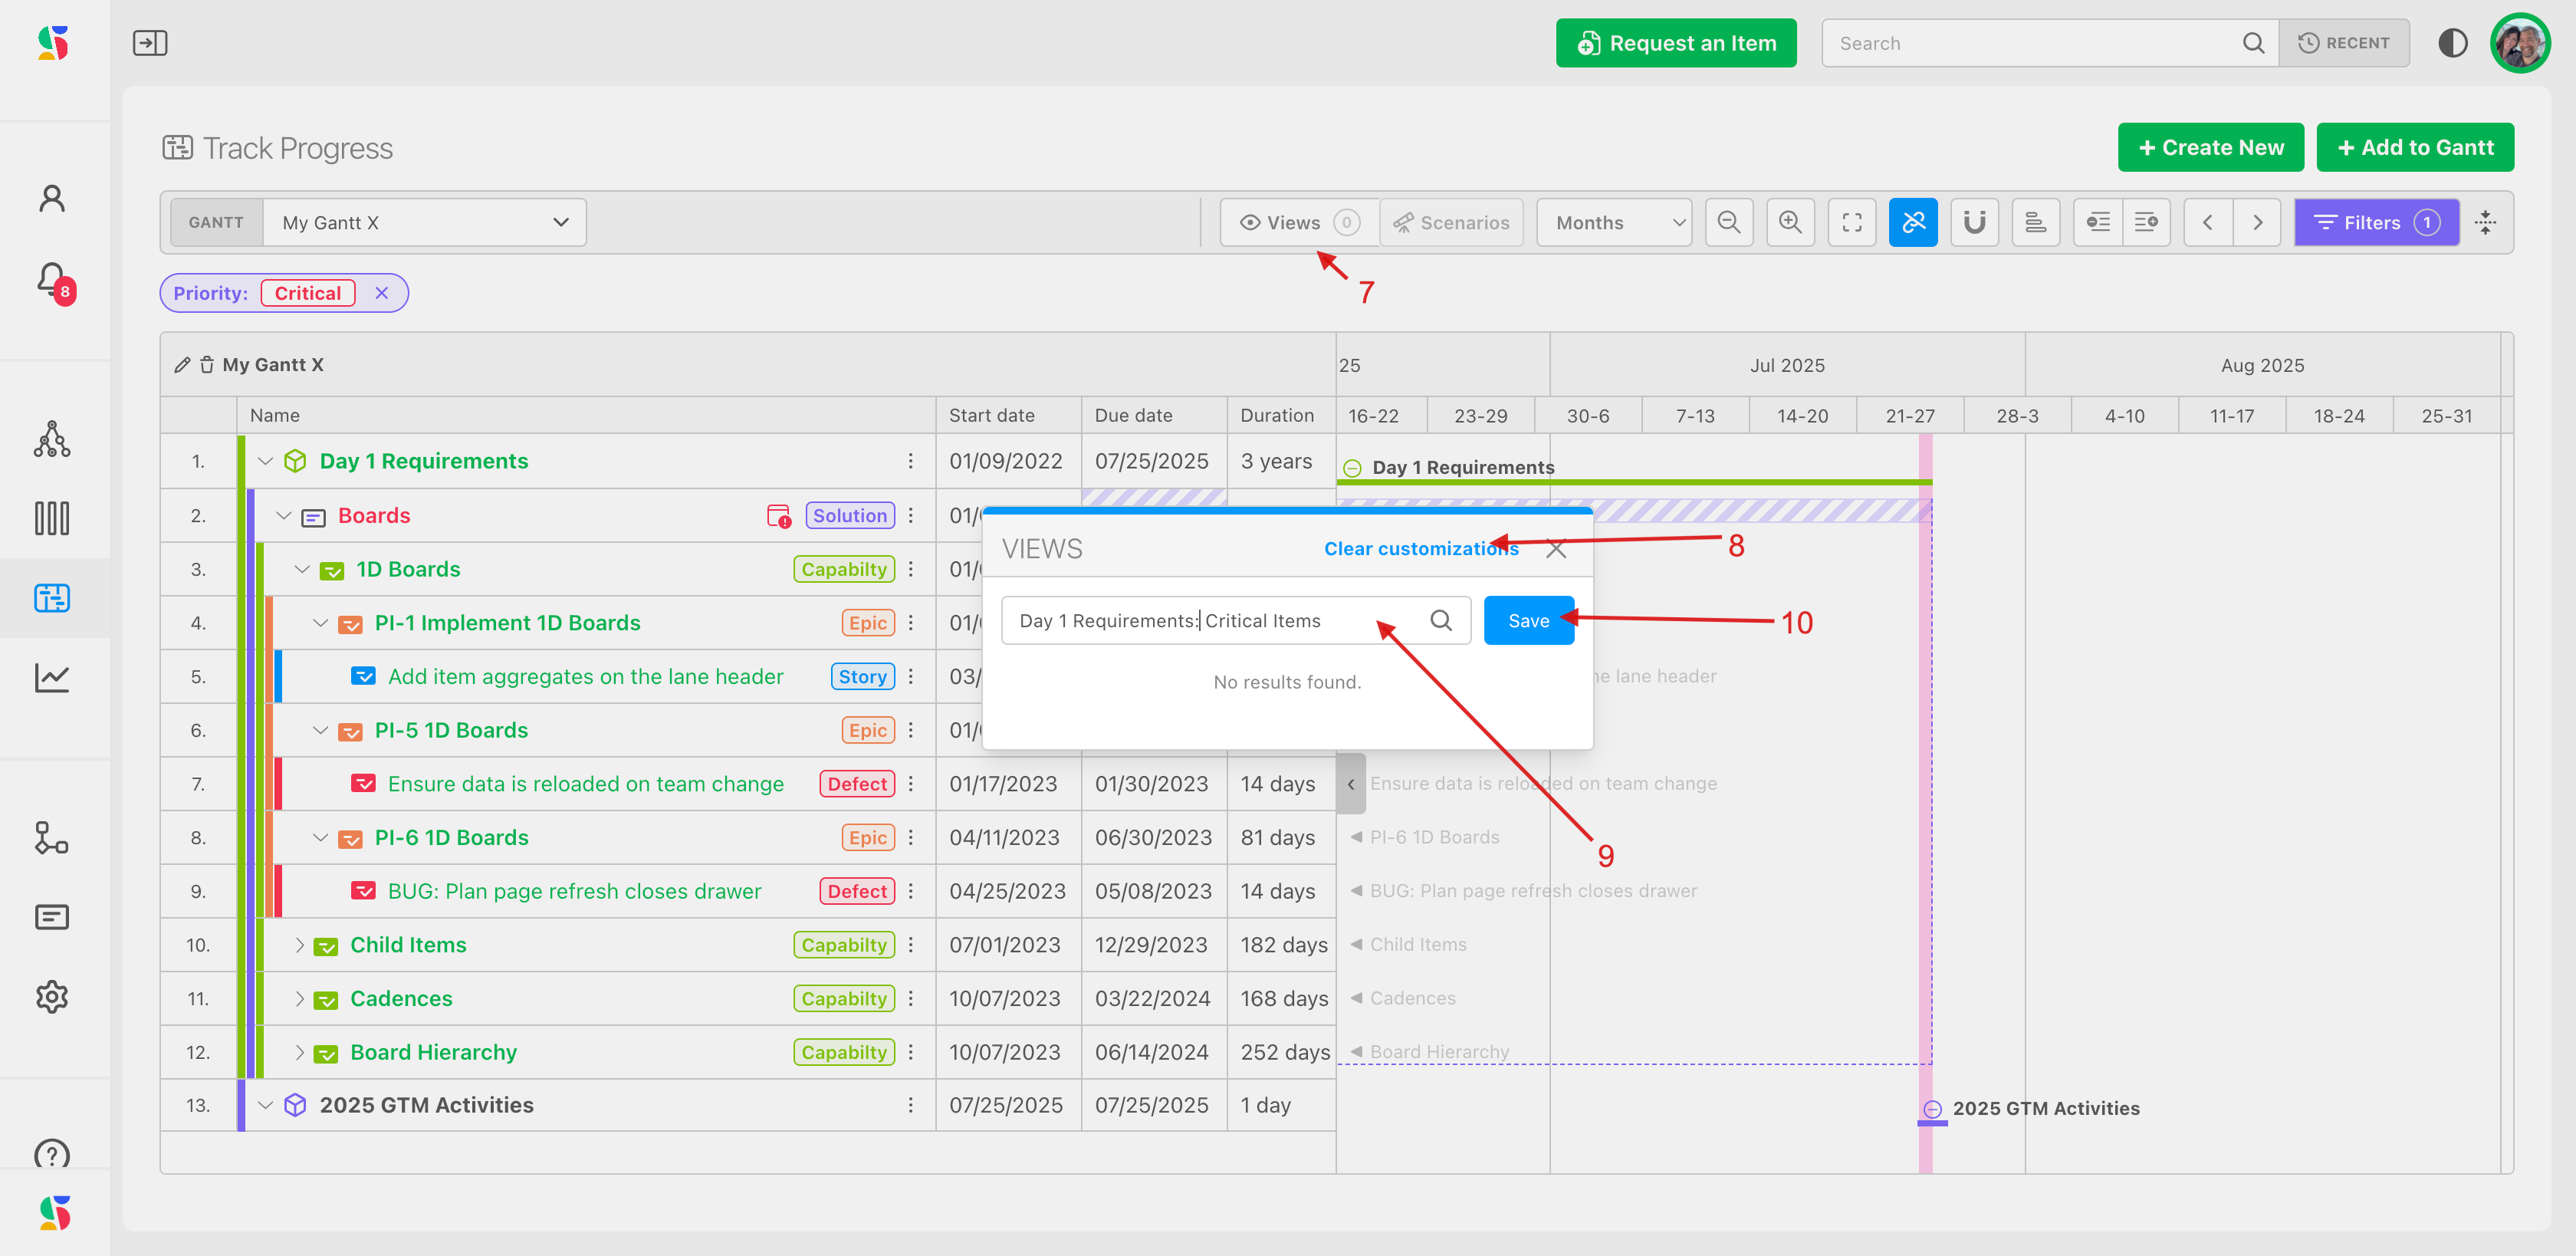
- Click Views. The Save as view button lists the customizations it detected: filters, zoom and row height, expanded rows, the chart, the progress setting, Linked/Unlinked mode, item numbers, sorting by start date, scroll position, and an applied baseline scenario.
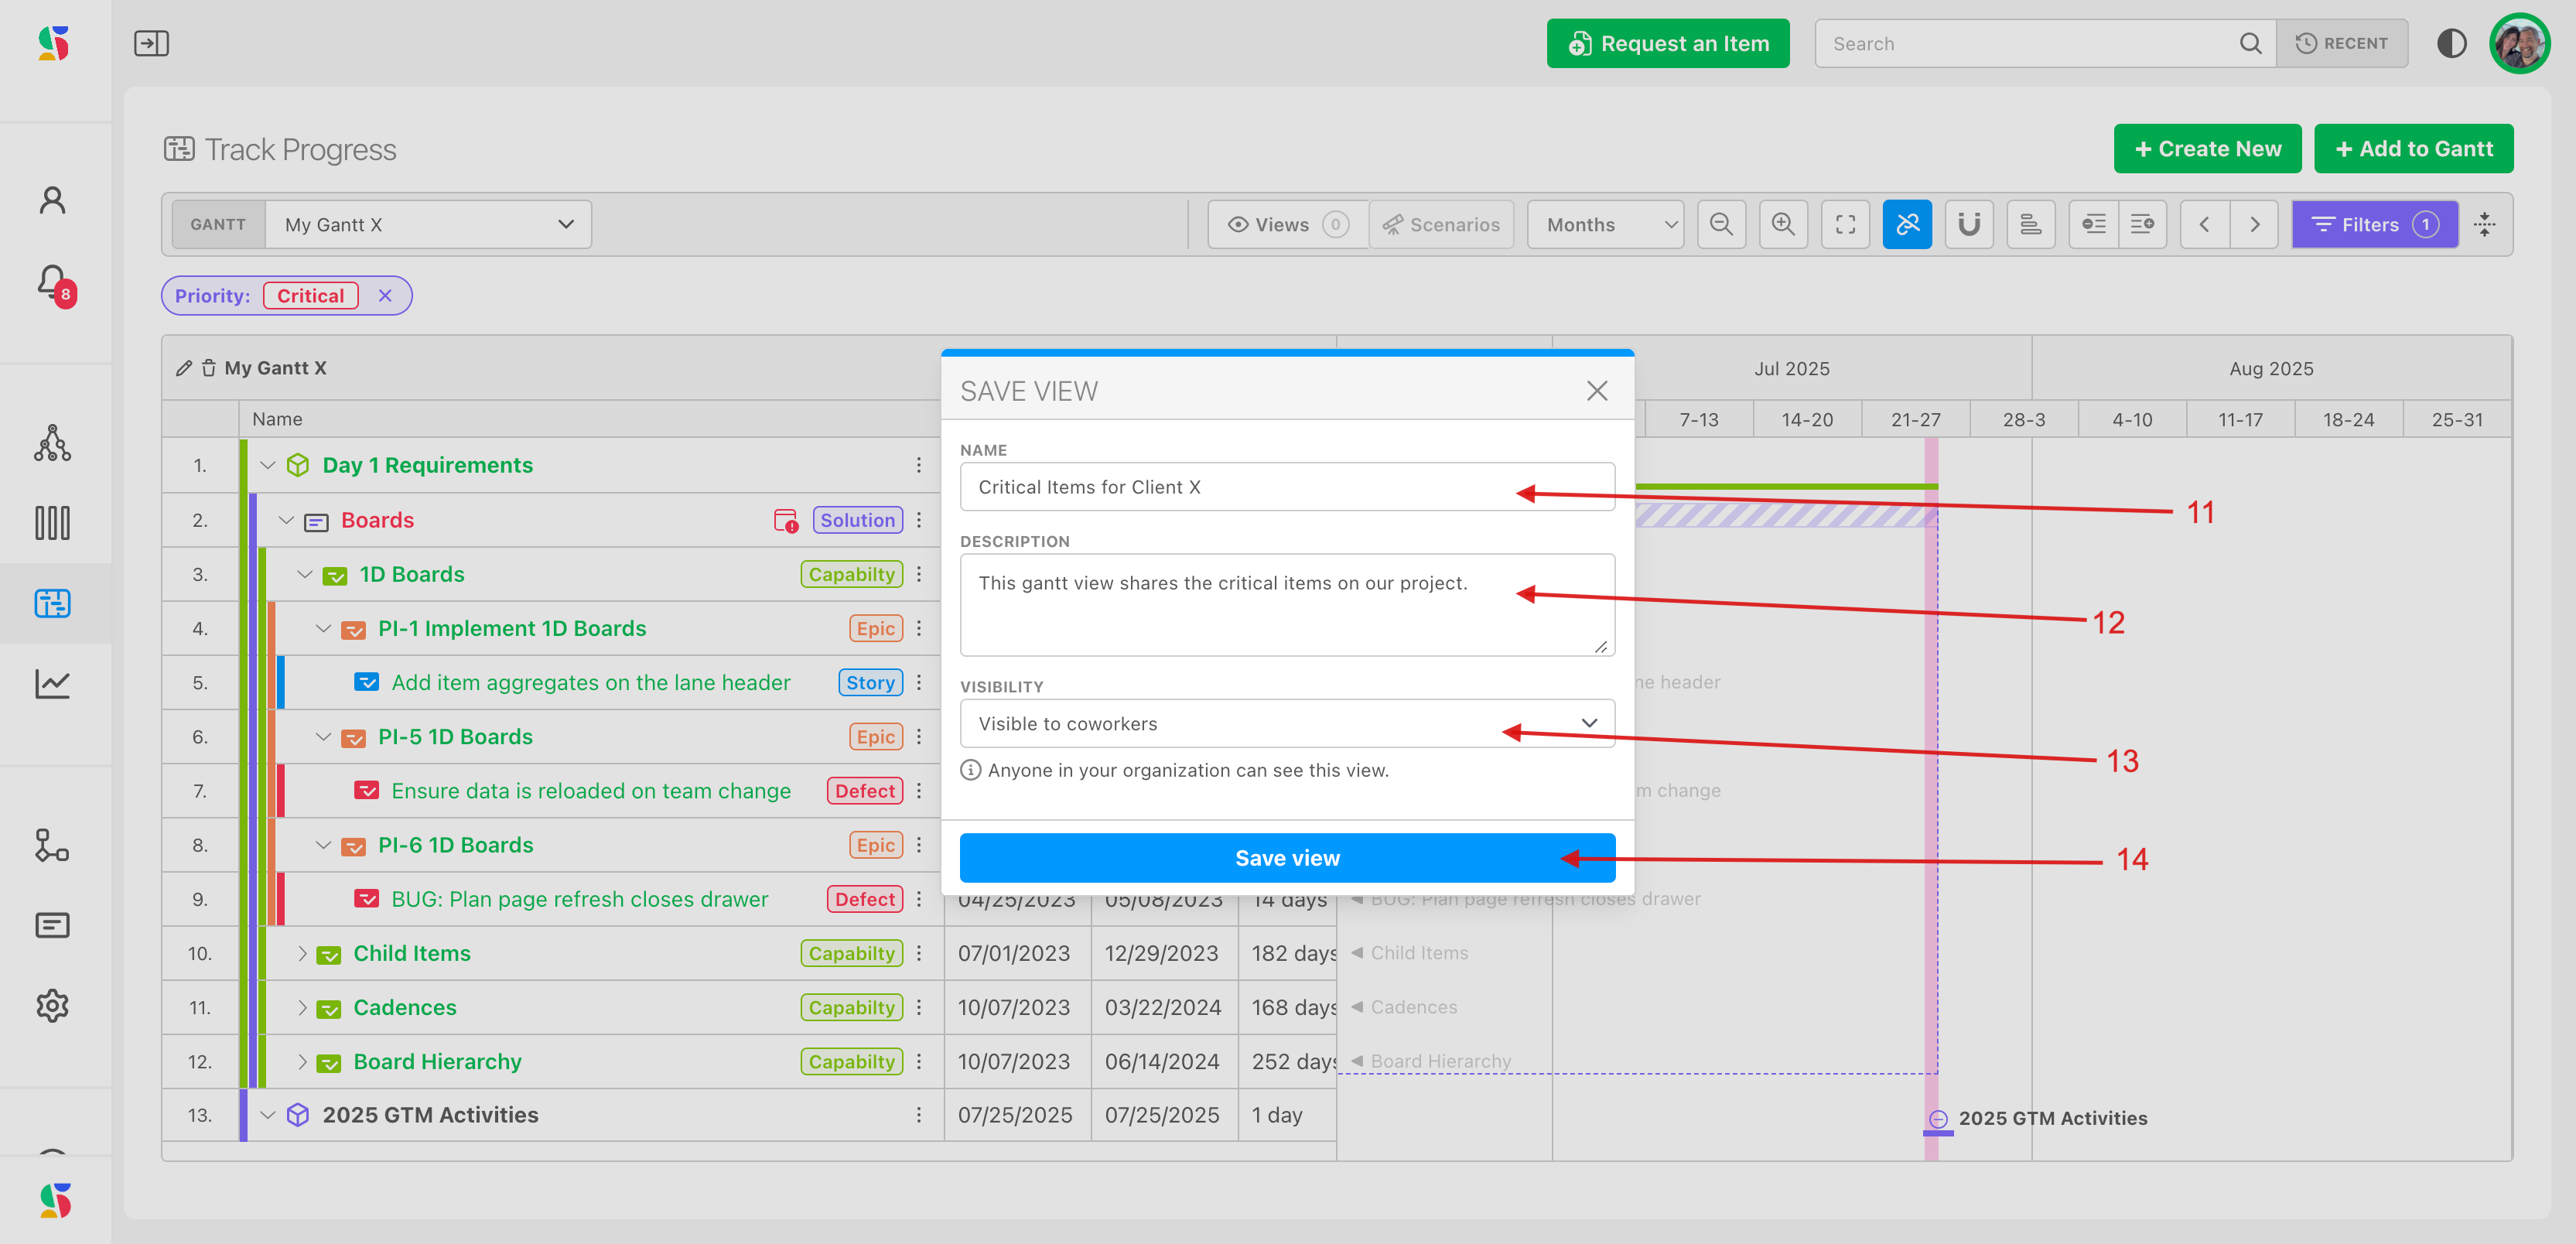
- In Save view, enter a Name and optional Description, and set Visibility to Visible only to you or Visible to coworkers. Click Save.
To use or share a view, click Views, find it with Find, and use the row actions: Copy link, Edit view, Delete view. Opening a shared link switches to the right chart and applies everything the view stored.
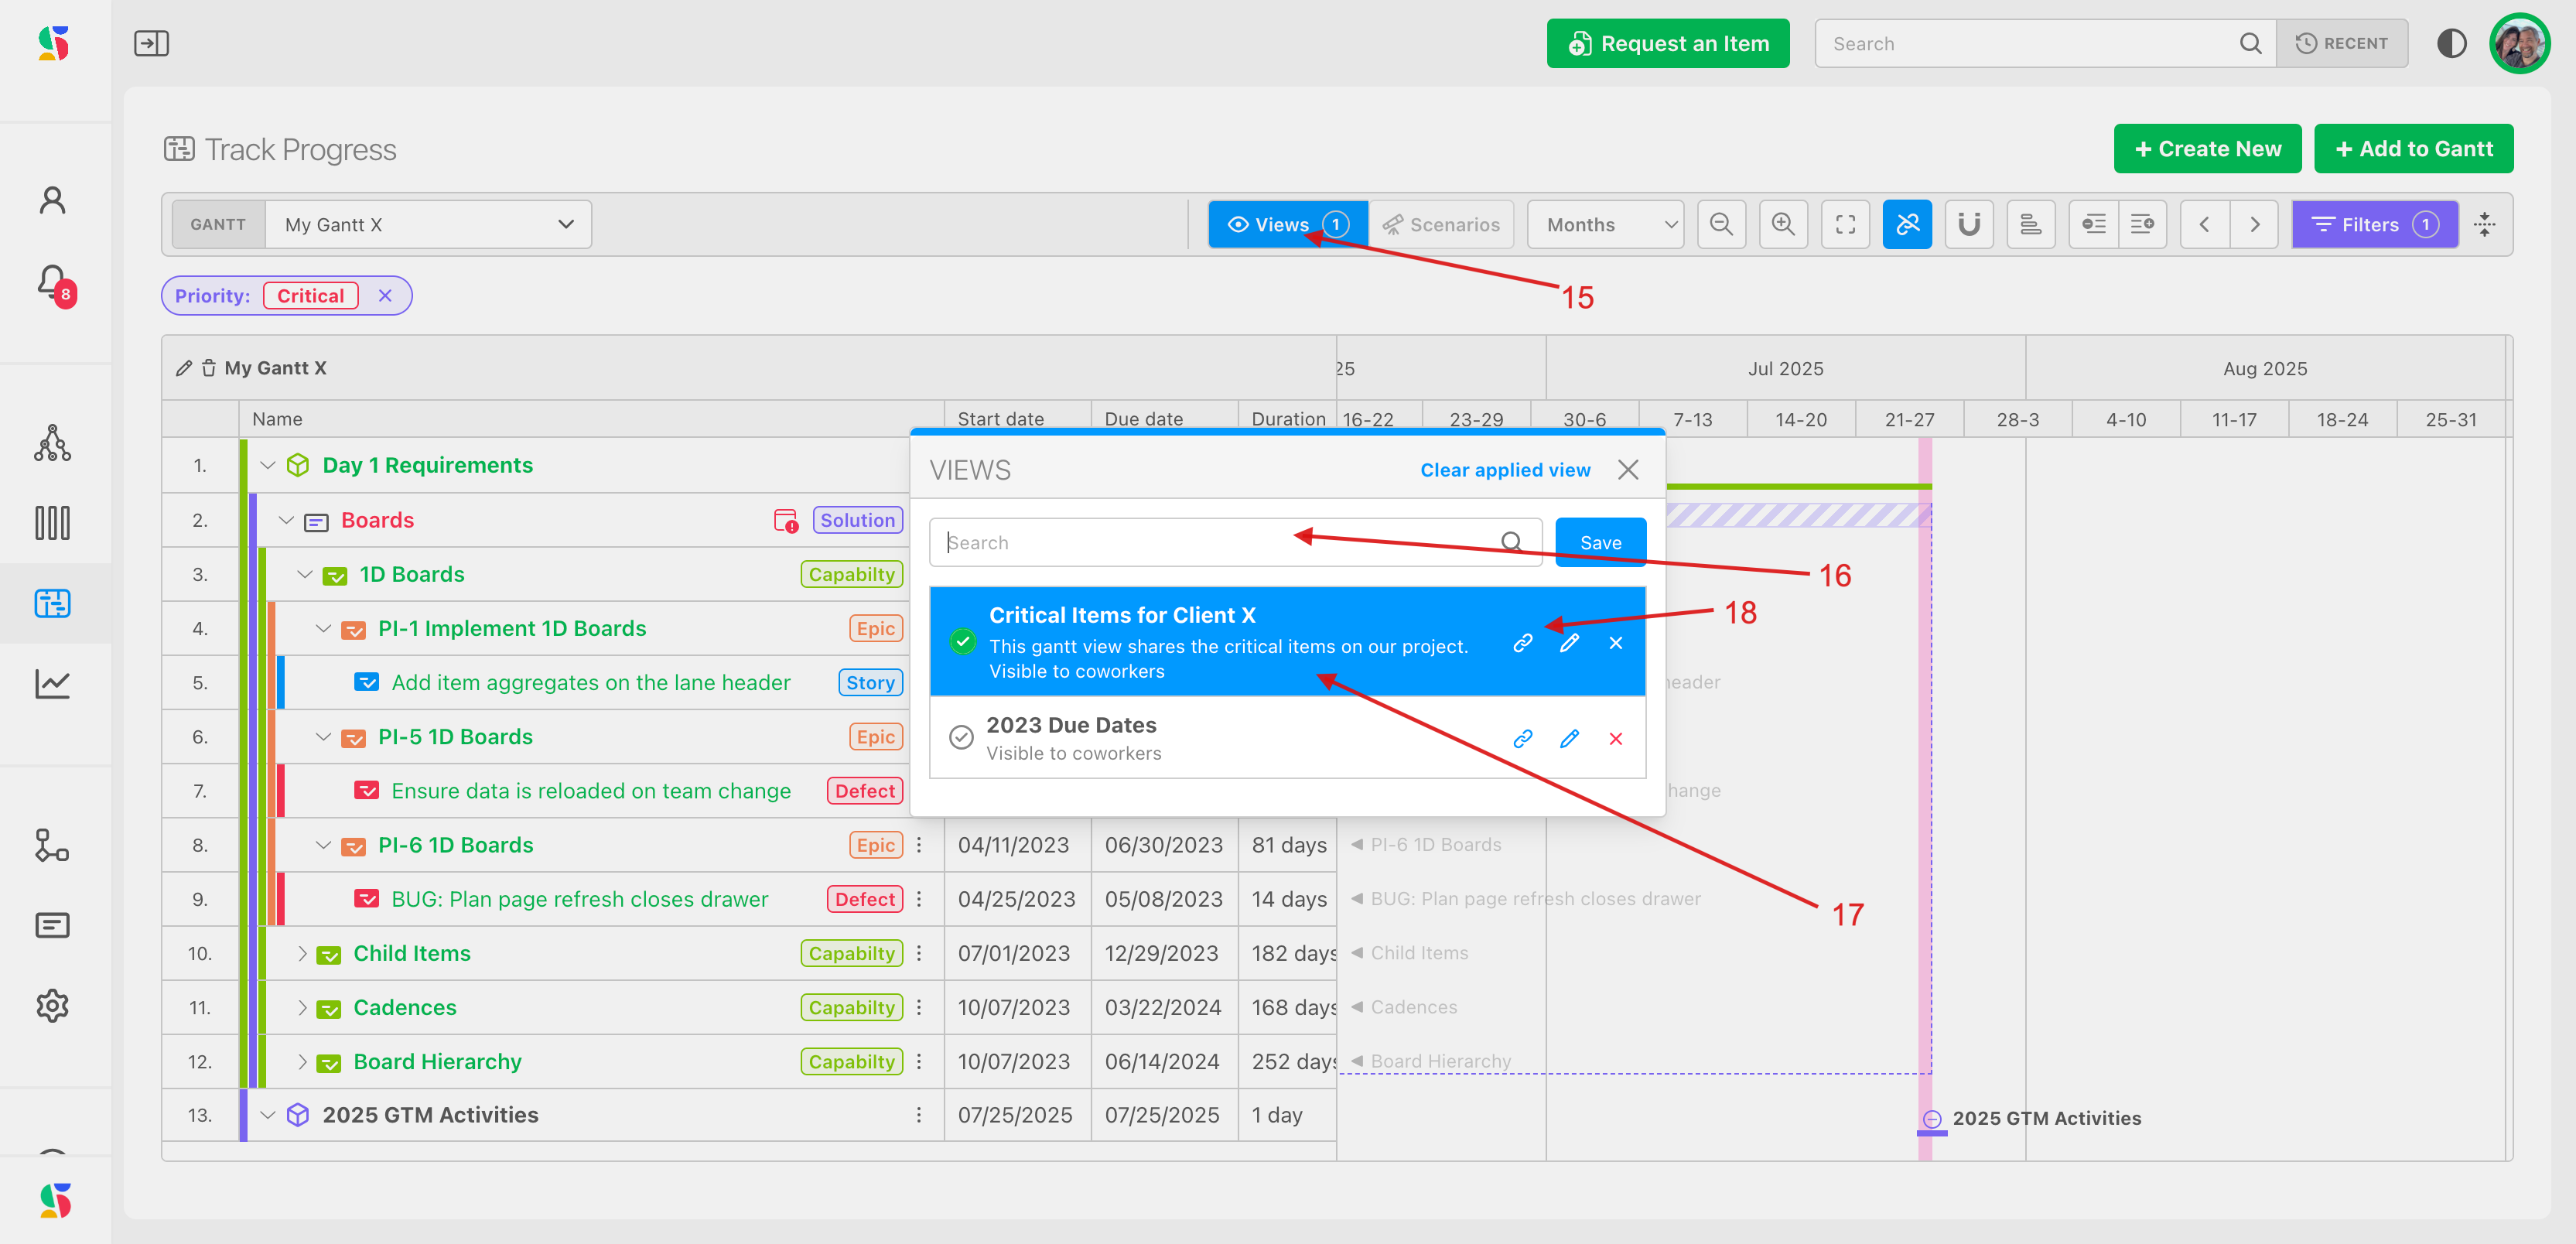
Saving views needs CREATE_STORED_VIEW. The snap-to-cycles folder is not part of a view.
Open an item from the chart#
Double-click any row, or choose Options then Edit, to open the item workspace for a workstream or item, or the edit dialog for an initiative or milestone. Open in new tab keeps the chart where it is. See Navigating the table for inline editing.
Considerations and best practices
Perpetual board items have no cycle to borrow dates from. Give them a start and due date in the item, in the Items Table, or by accepting the inferred date on the chart. If they really should be scheduled, consider moving them to a cycle board. See Setting up and using perpetual boards.
Cycle dates: items inherit their cycle's dates only when the organization setting Sync work item dates with their cycles is on.
Dependencies: a bad chain moves good dates. Check the Dependency Graph before you enable Linked mode on a chart you did not build.
Granularity: keep executive charts at workstream level and let people expand. Groups, filters and saved views are cheaper than more charts.