
Using Gantt Charts: Navigating the timeline
Move and resize bars, zoom and pan, snap work to a team's cycles, draw dependencies between bars, and choose whether a slipped date pushes dependent work.
On this page
The timeline is the right half of the chart. Everything you do to a bar there is written to the real item: drag a bar and the item's start and due dates change everywhere else in DevStride. This page covers the interactions. For the columns on the left, see Navigating the table.
You can drag bars only if you can edit the chart and update the item. Rows you cannot change still display, but their bars do not move.
Move and resize bars#
Hover a bar to reveal its handles.
| Do this | Result |
|---|---|
| Drag the middle of the bar | Moves the bar: start and due date shift together, duration unchanged |
| Drag the left edge | Changes the start date |
| Drag the right edge | Changes the due date |
| Drag a milestone diamond | Changes the milestone date |
| Click a bar that shows Date missing | Sets the missing start or due date to the inferred date shown in the tooltip |
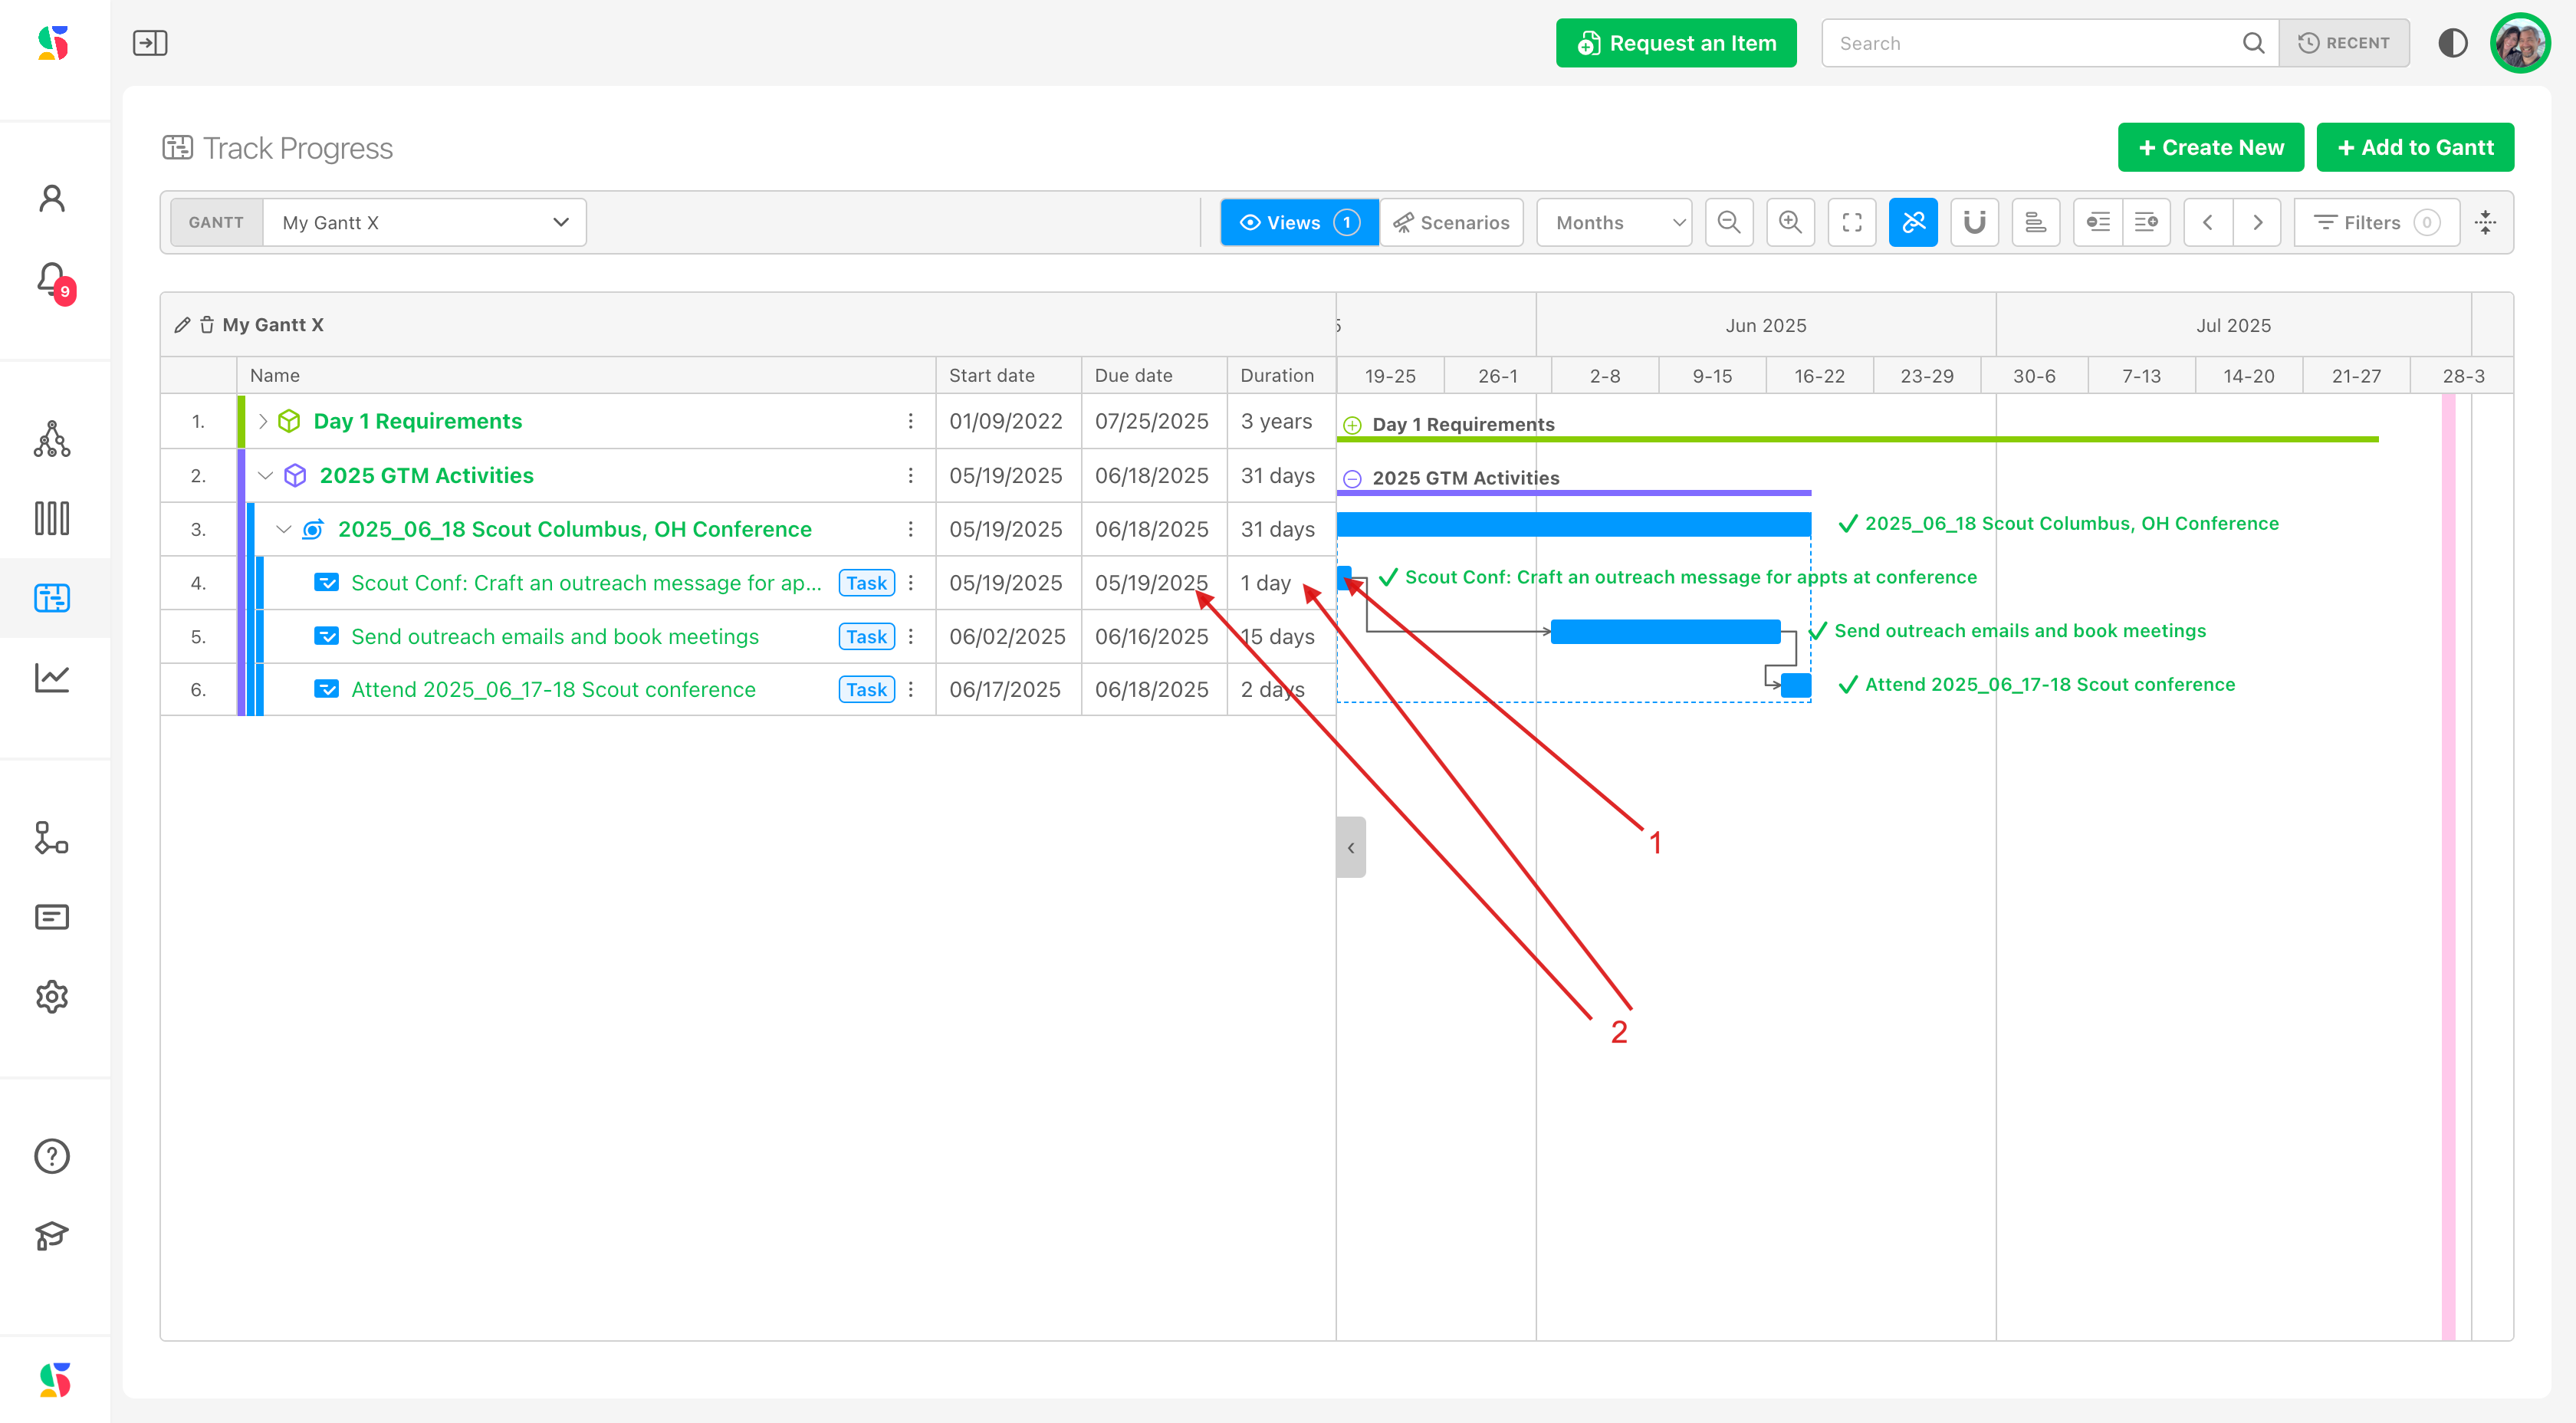
In the example, the task is due 5/19/25 with a 1-day duration (2).
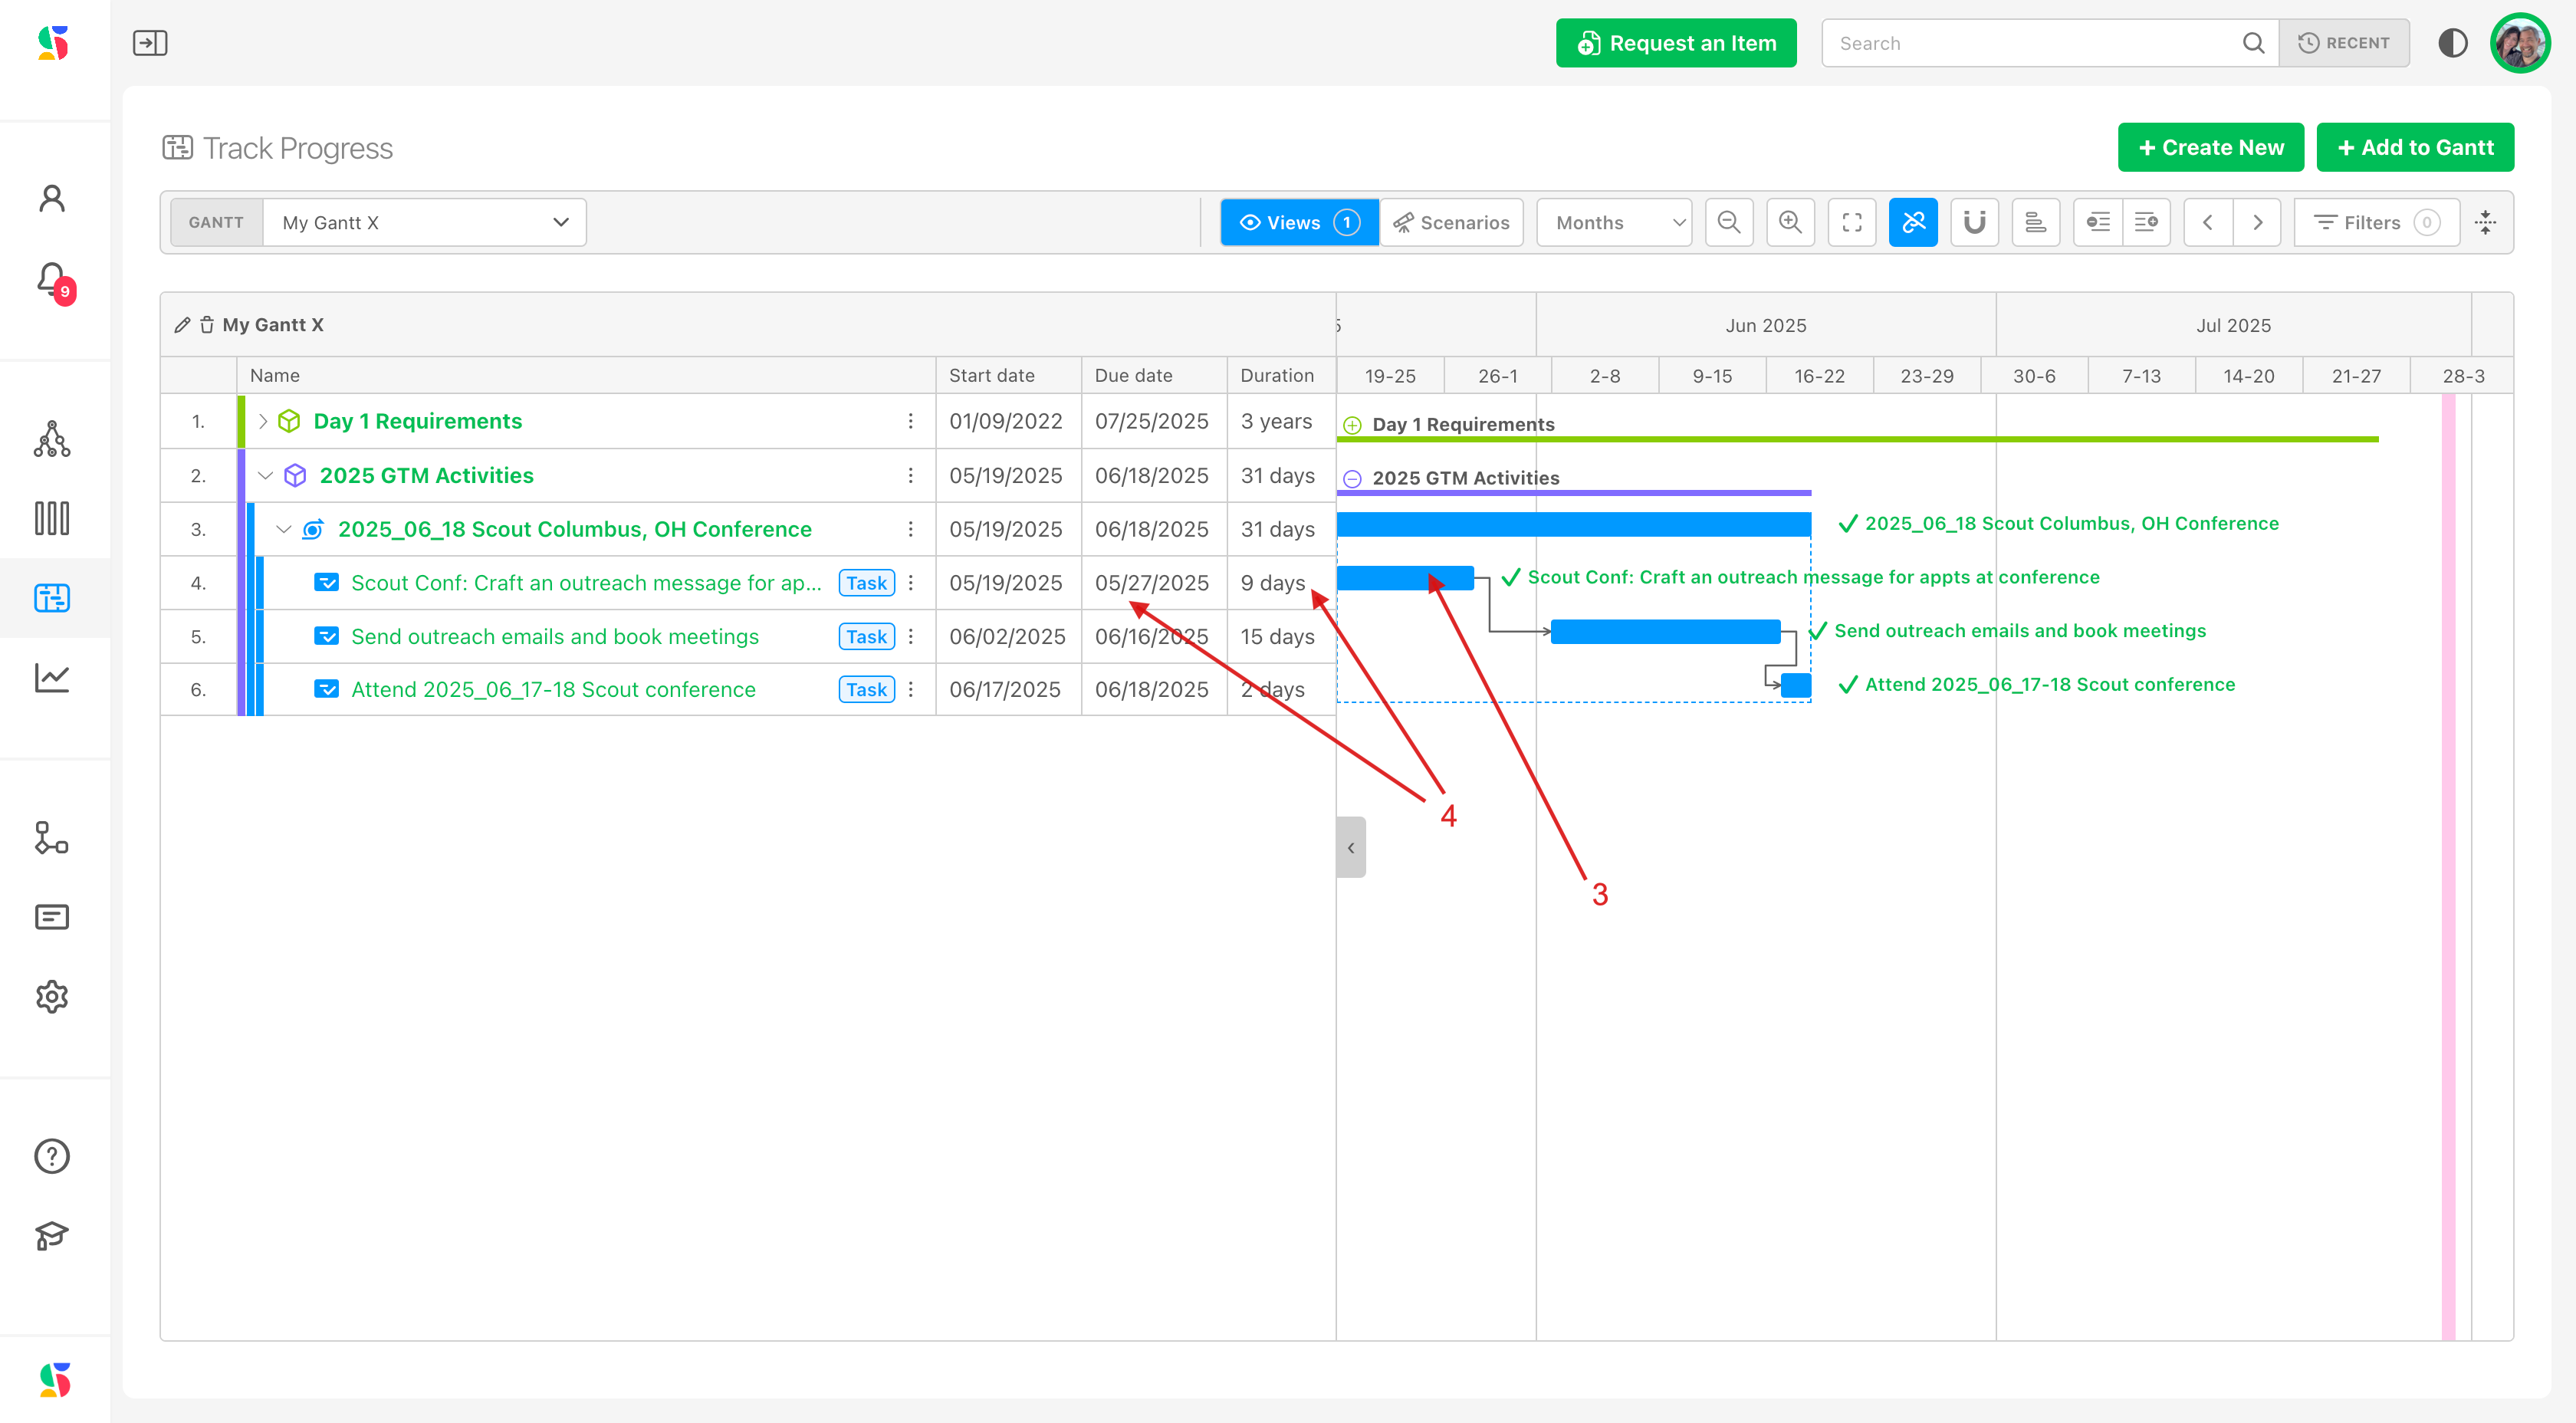
Dragging the right edge to 9 days updates the Due date and Duration cells as you drag (4).
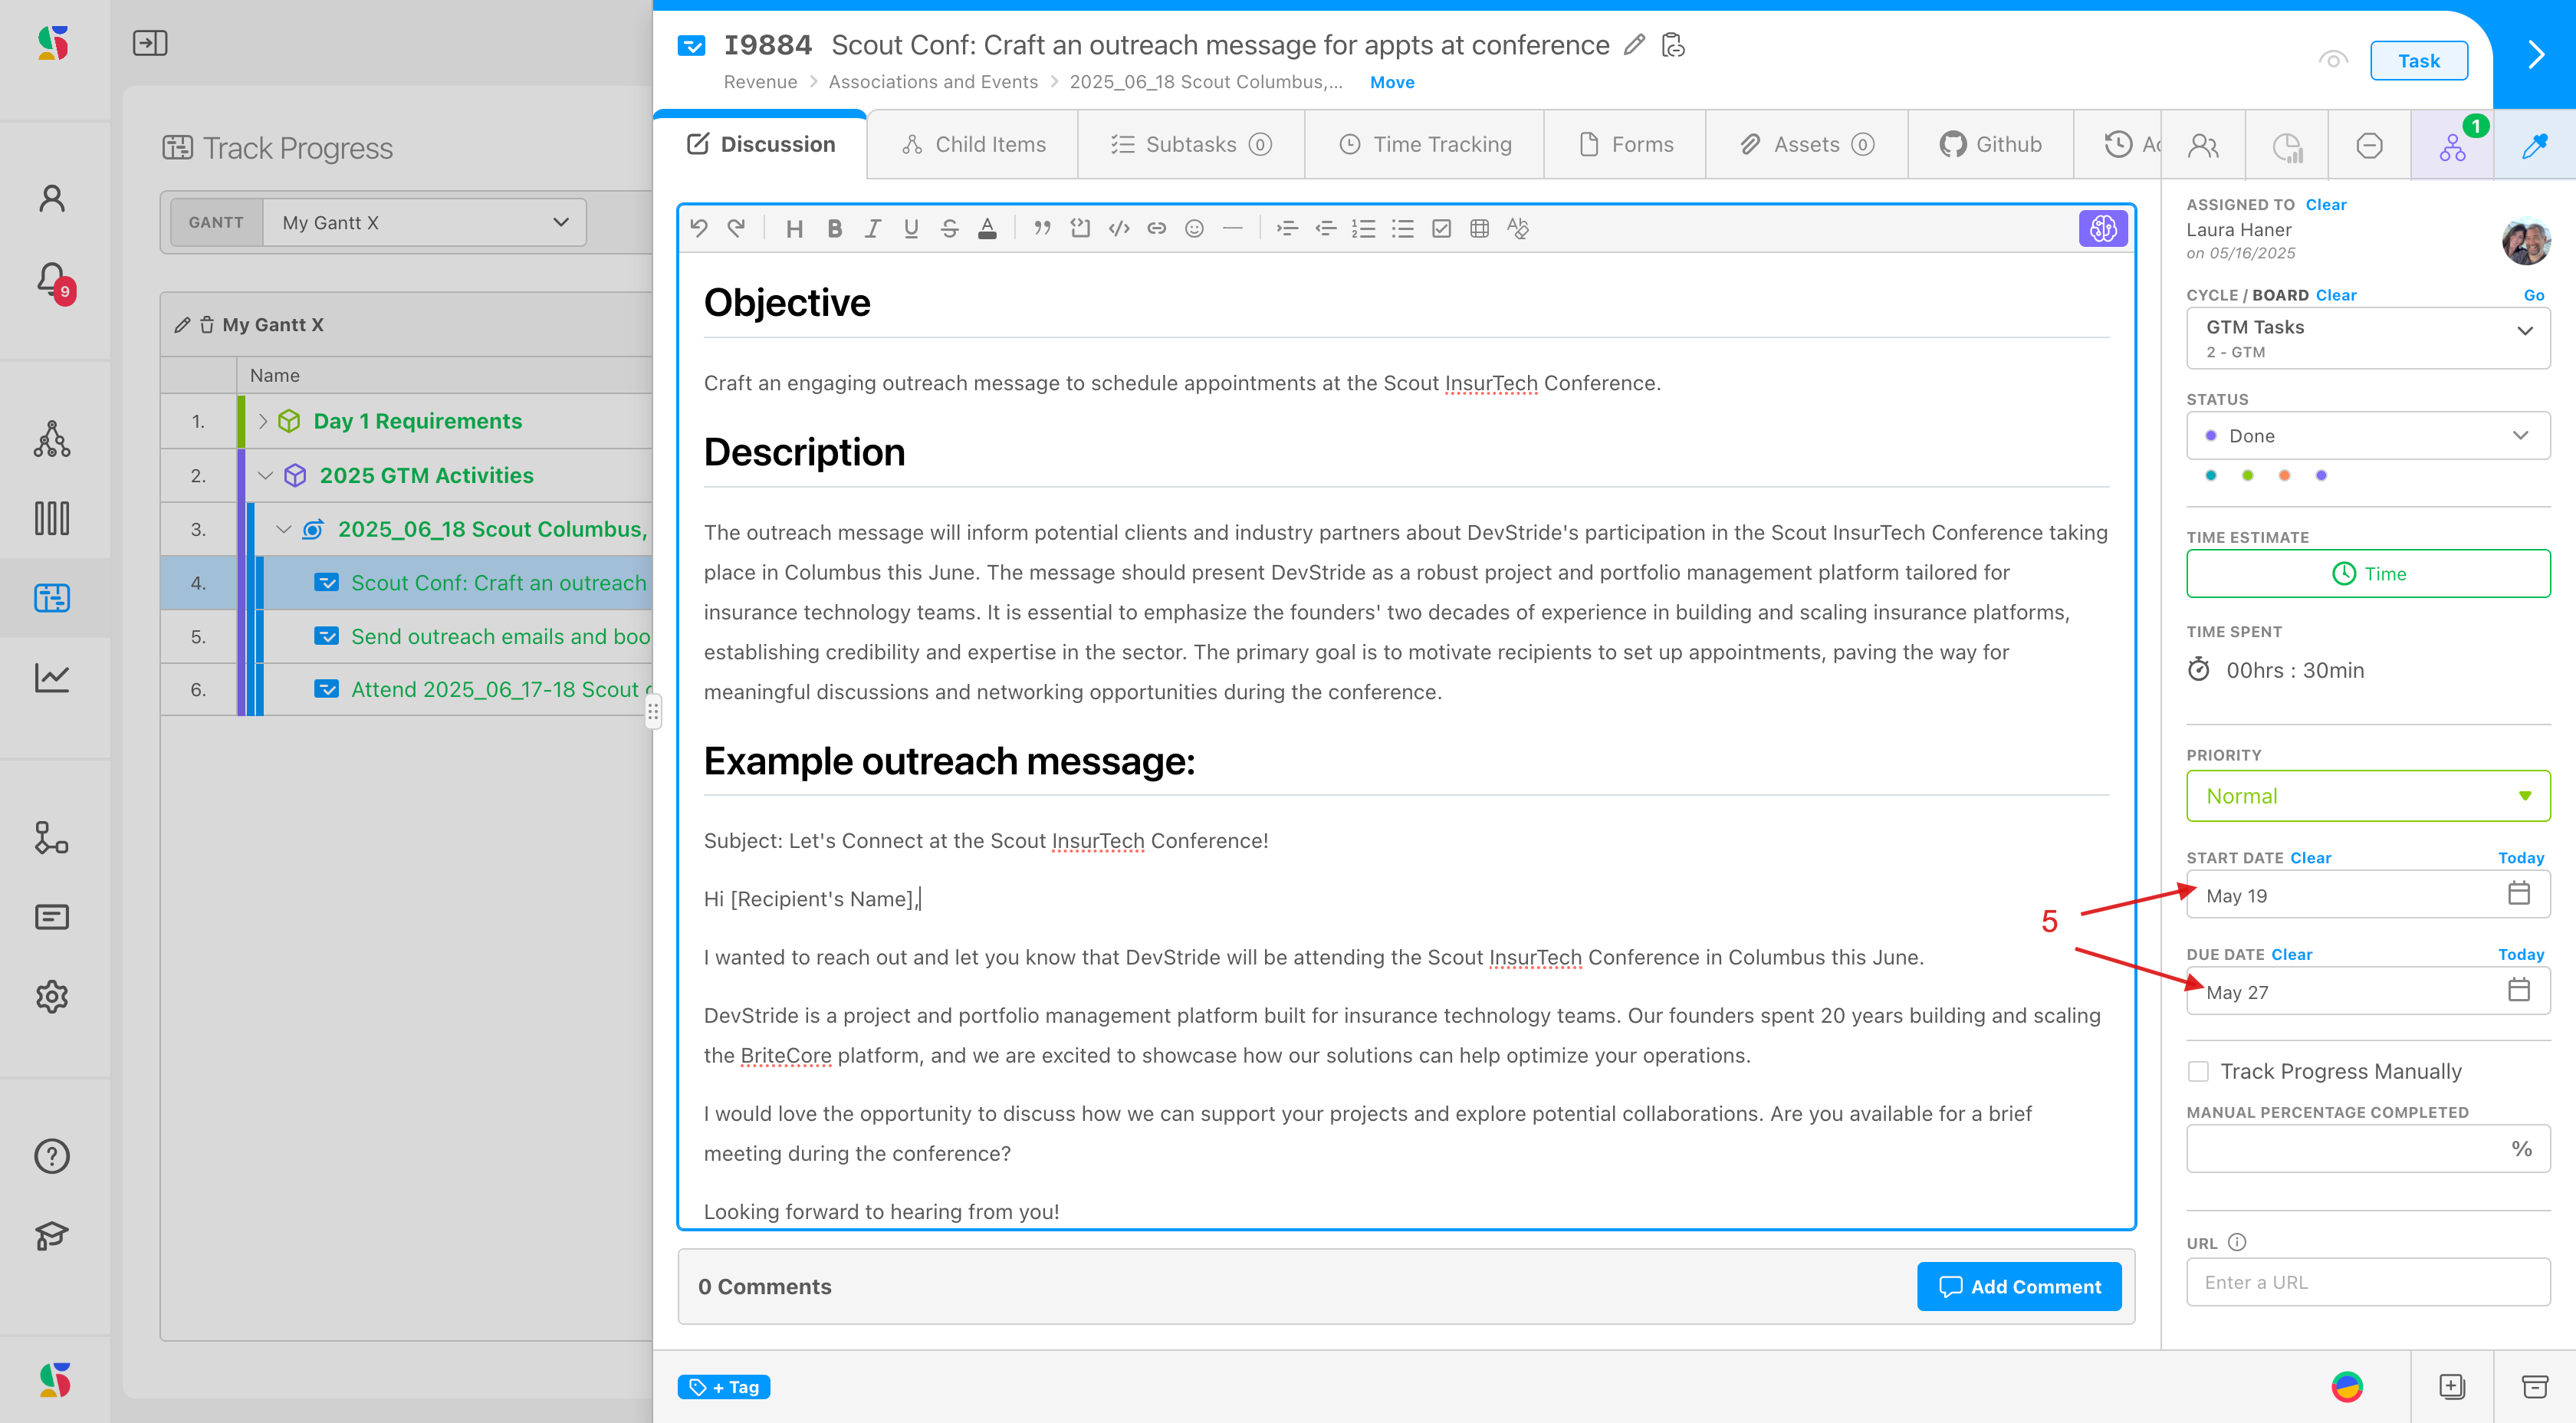
The item itself now carries the new dates (5).
While a drag is in flight the status strip at the top of the chart shows Saving dates.... If the item has dependents and Linked mode is on, the strip stays until the cascade finishes.
Initiative bars cannot be dragged. Their dates are inferred from the work inside them; move the children instead.
Zoom levels#
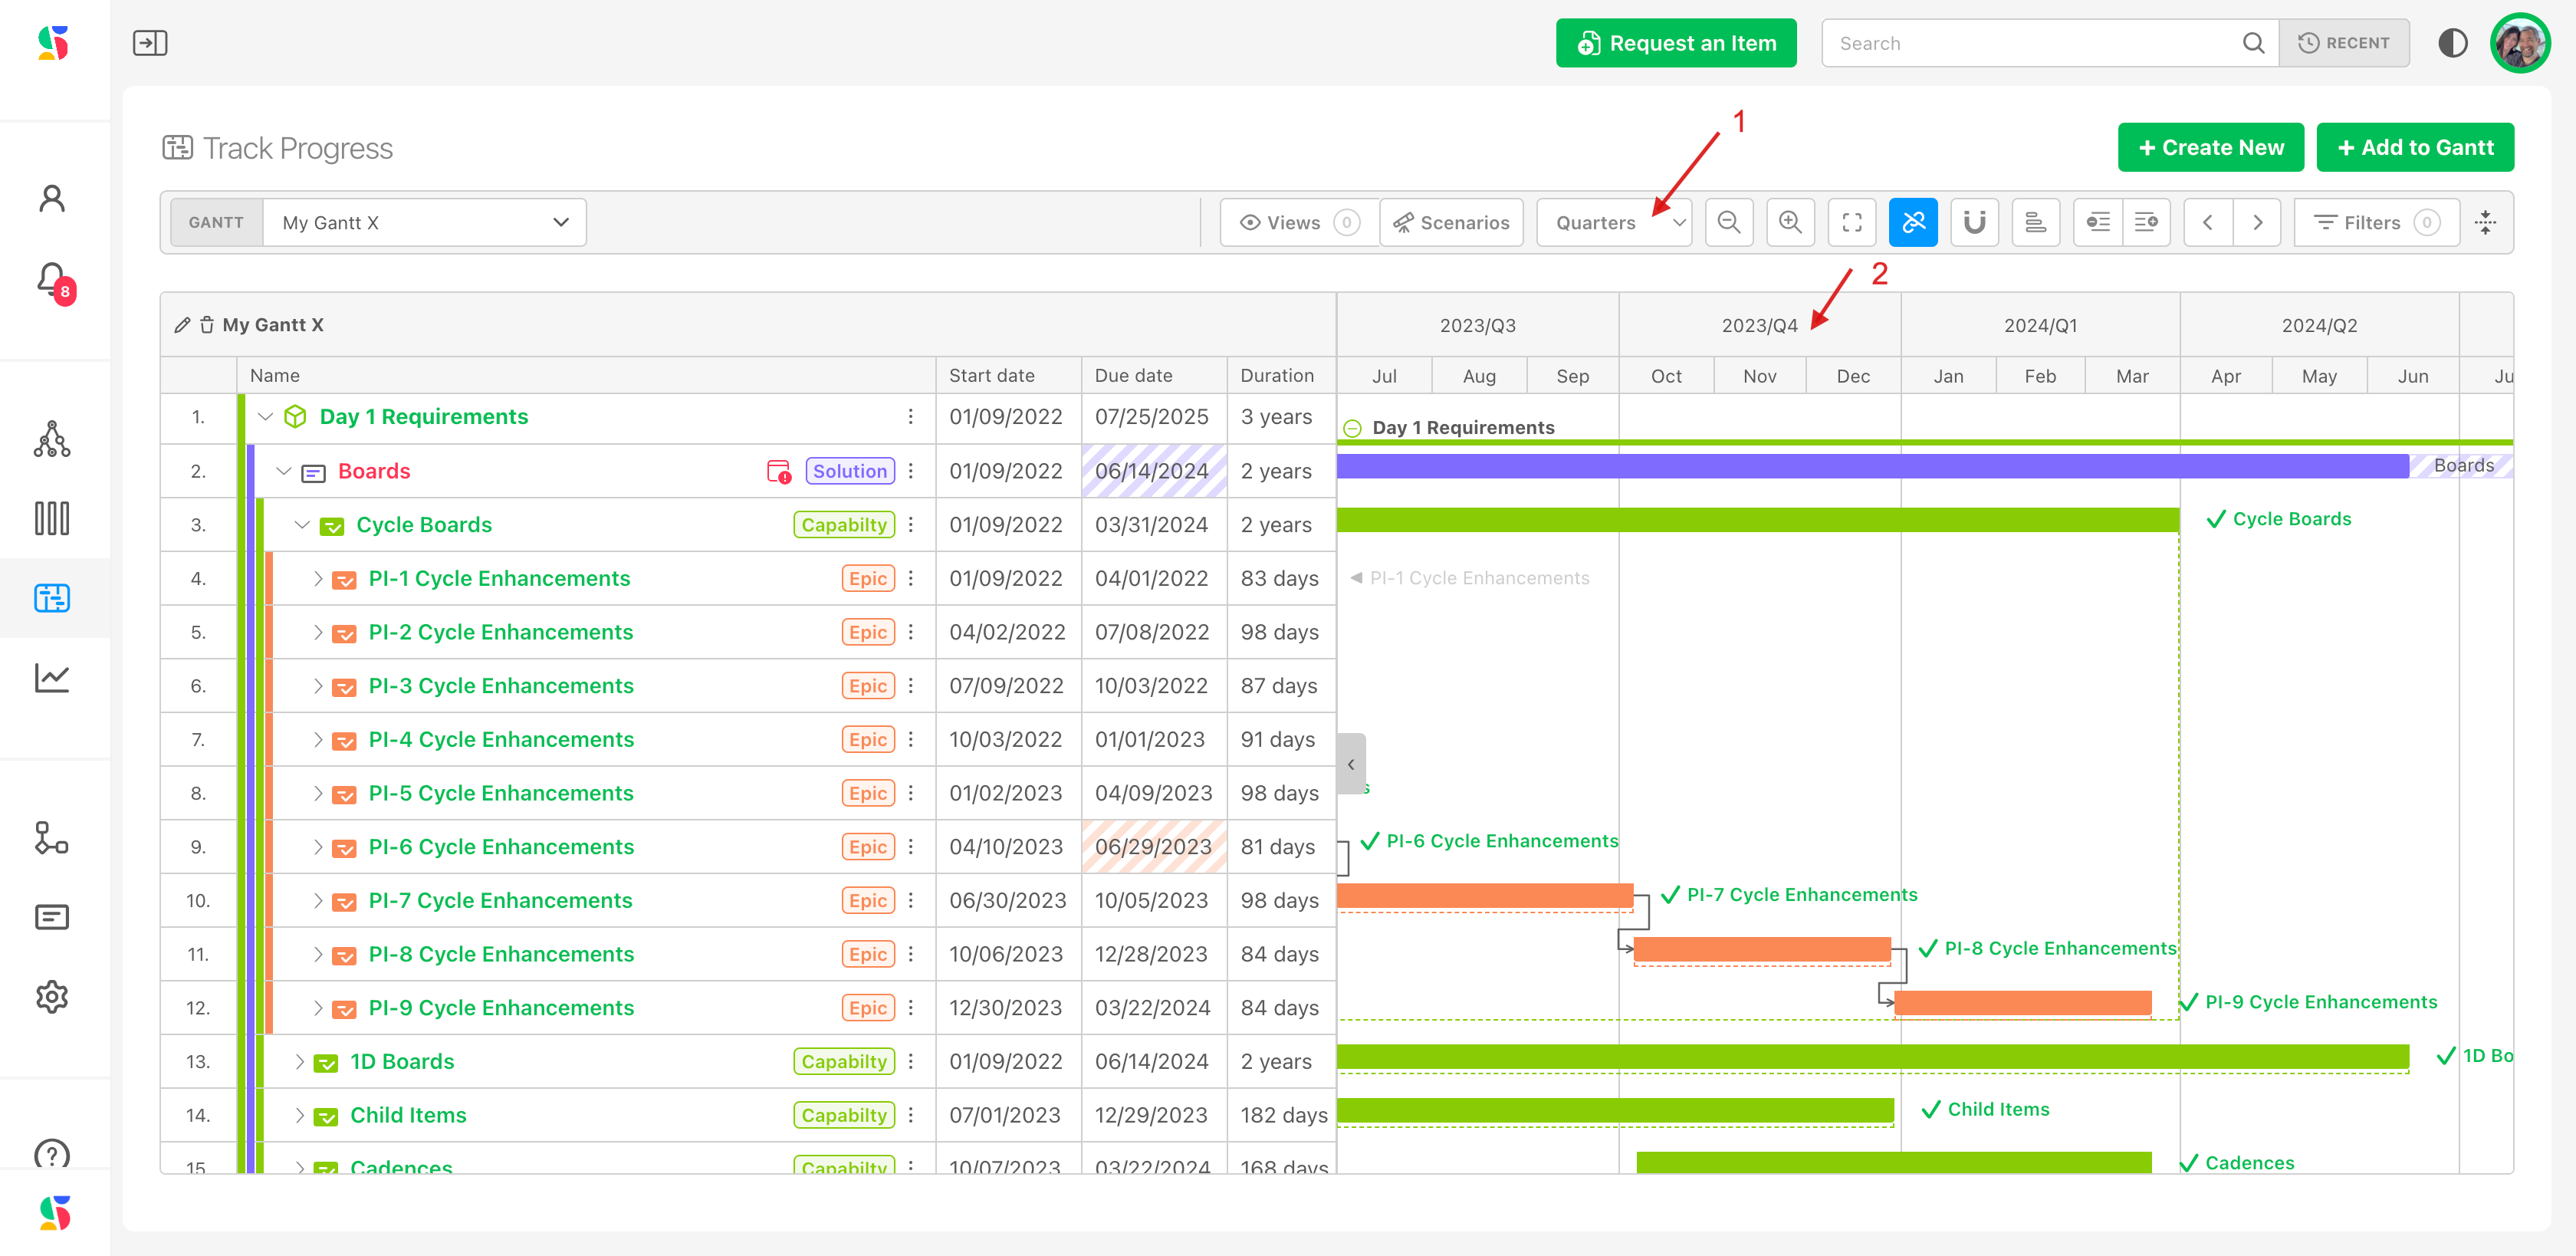
The Horizontal zoom slider steps through ten presets. The number beside it is the scale in pixels per day; click it to pick a preset directly.
| Preset | Scale | Header shows |
|---|---|---|
| Years | 0.25 px/day (1 px = 4 days) | Years, with quarters beneath |
| Years | 0.5 px/day | Years / Quarters |
| Years | 1 px/day | Years / Quarters |
| Quarters | 2 px/day | Quarters / Months |
| Quarters | 4 px/day (default for new charts) | Quarters / Months |
| Months | 8 px/day | Months / Weeks |
| Months | 16 px/day | Months / Weeks |
| Weeks | 32 px/day | Weeks / Days |
| Weeks | 64 px/day | Weeks / Days |
| Days | 100 px/day | Days, with the year above |
Double-click an empty part of the timeline to zoom in one step centered on that point; Shift + double-click zooms out. The zoom level is remembered per chart in your browser and is stored in saved views.
Pan and find your place#
- Drag an empty part of the timeline to pan in any direction. The cursor turns into a hand.
- Scroll gantt to the left / Scroll gantt to the right (chevrons in the control bar): hold to scroll continuously.
- Go to today (calendar icon) centers on the TODAY line.
- Click a date in the header to center the view on it.
- A faint vertical line marks the current center of the view. Saved views store this center point and restore it. A view with no stored position opens at the chart's first item, or at today if the chart has none.
- Bars that are out of view get an arrow button at the chart edge labeled with the item name. Click it to jump there.
- Row height slider and field (20 to 50 px, default 35) make the chart denser or roomier.
Snap to cycles#
Snap to cycles (magnet) overlays one board folder's cycles, such as a team's sprints, as bands behind the bars. With a folder selected, dragging behaves differently for work items:
- A moved bar cannot straddle a cycle boundary. The drag stops at the edge of the cycle it is in.
- Dropping a moved bar inside a cycle moves the item to that cycle's board. The Cycle / Board column updates.
- Dropping a moved bar clear of every cycle sets the item to No board.
- Resizing an edge, Shift + click auto-dates and date edits in the table never change the board. Only a whole-bar move does.
Workstreams and milestones ignore the bands; they are never assigned to a board.
Snapping reassigns sprints
With a folder selected, every bar move is also a sprint move. If you only want to see sprint alignment without changing anything, look but do not drag, or switch to Unlinked mode and drag carefully. The selected folder is not saved with the chart or with saved views, so each session starts without a lens.
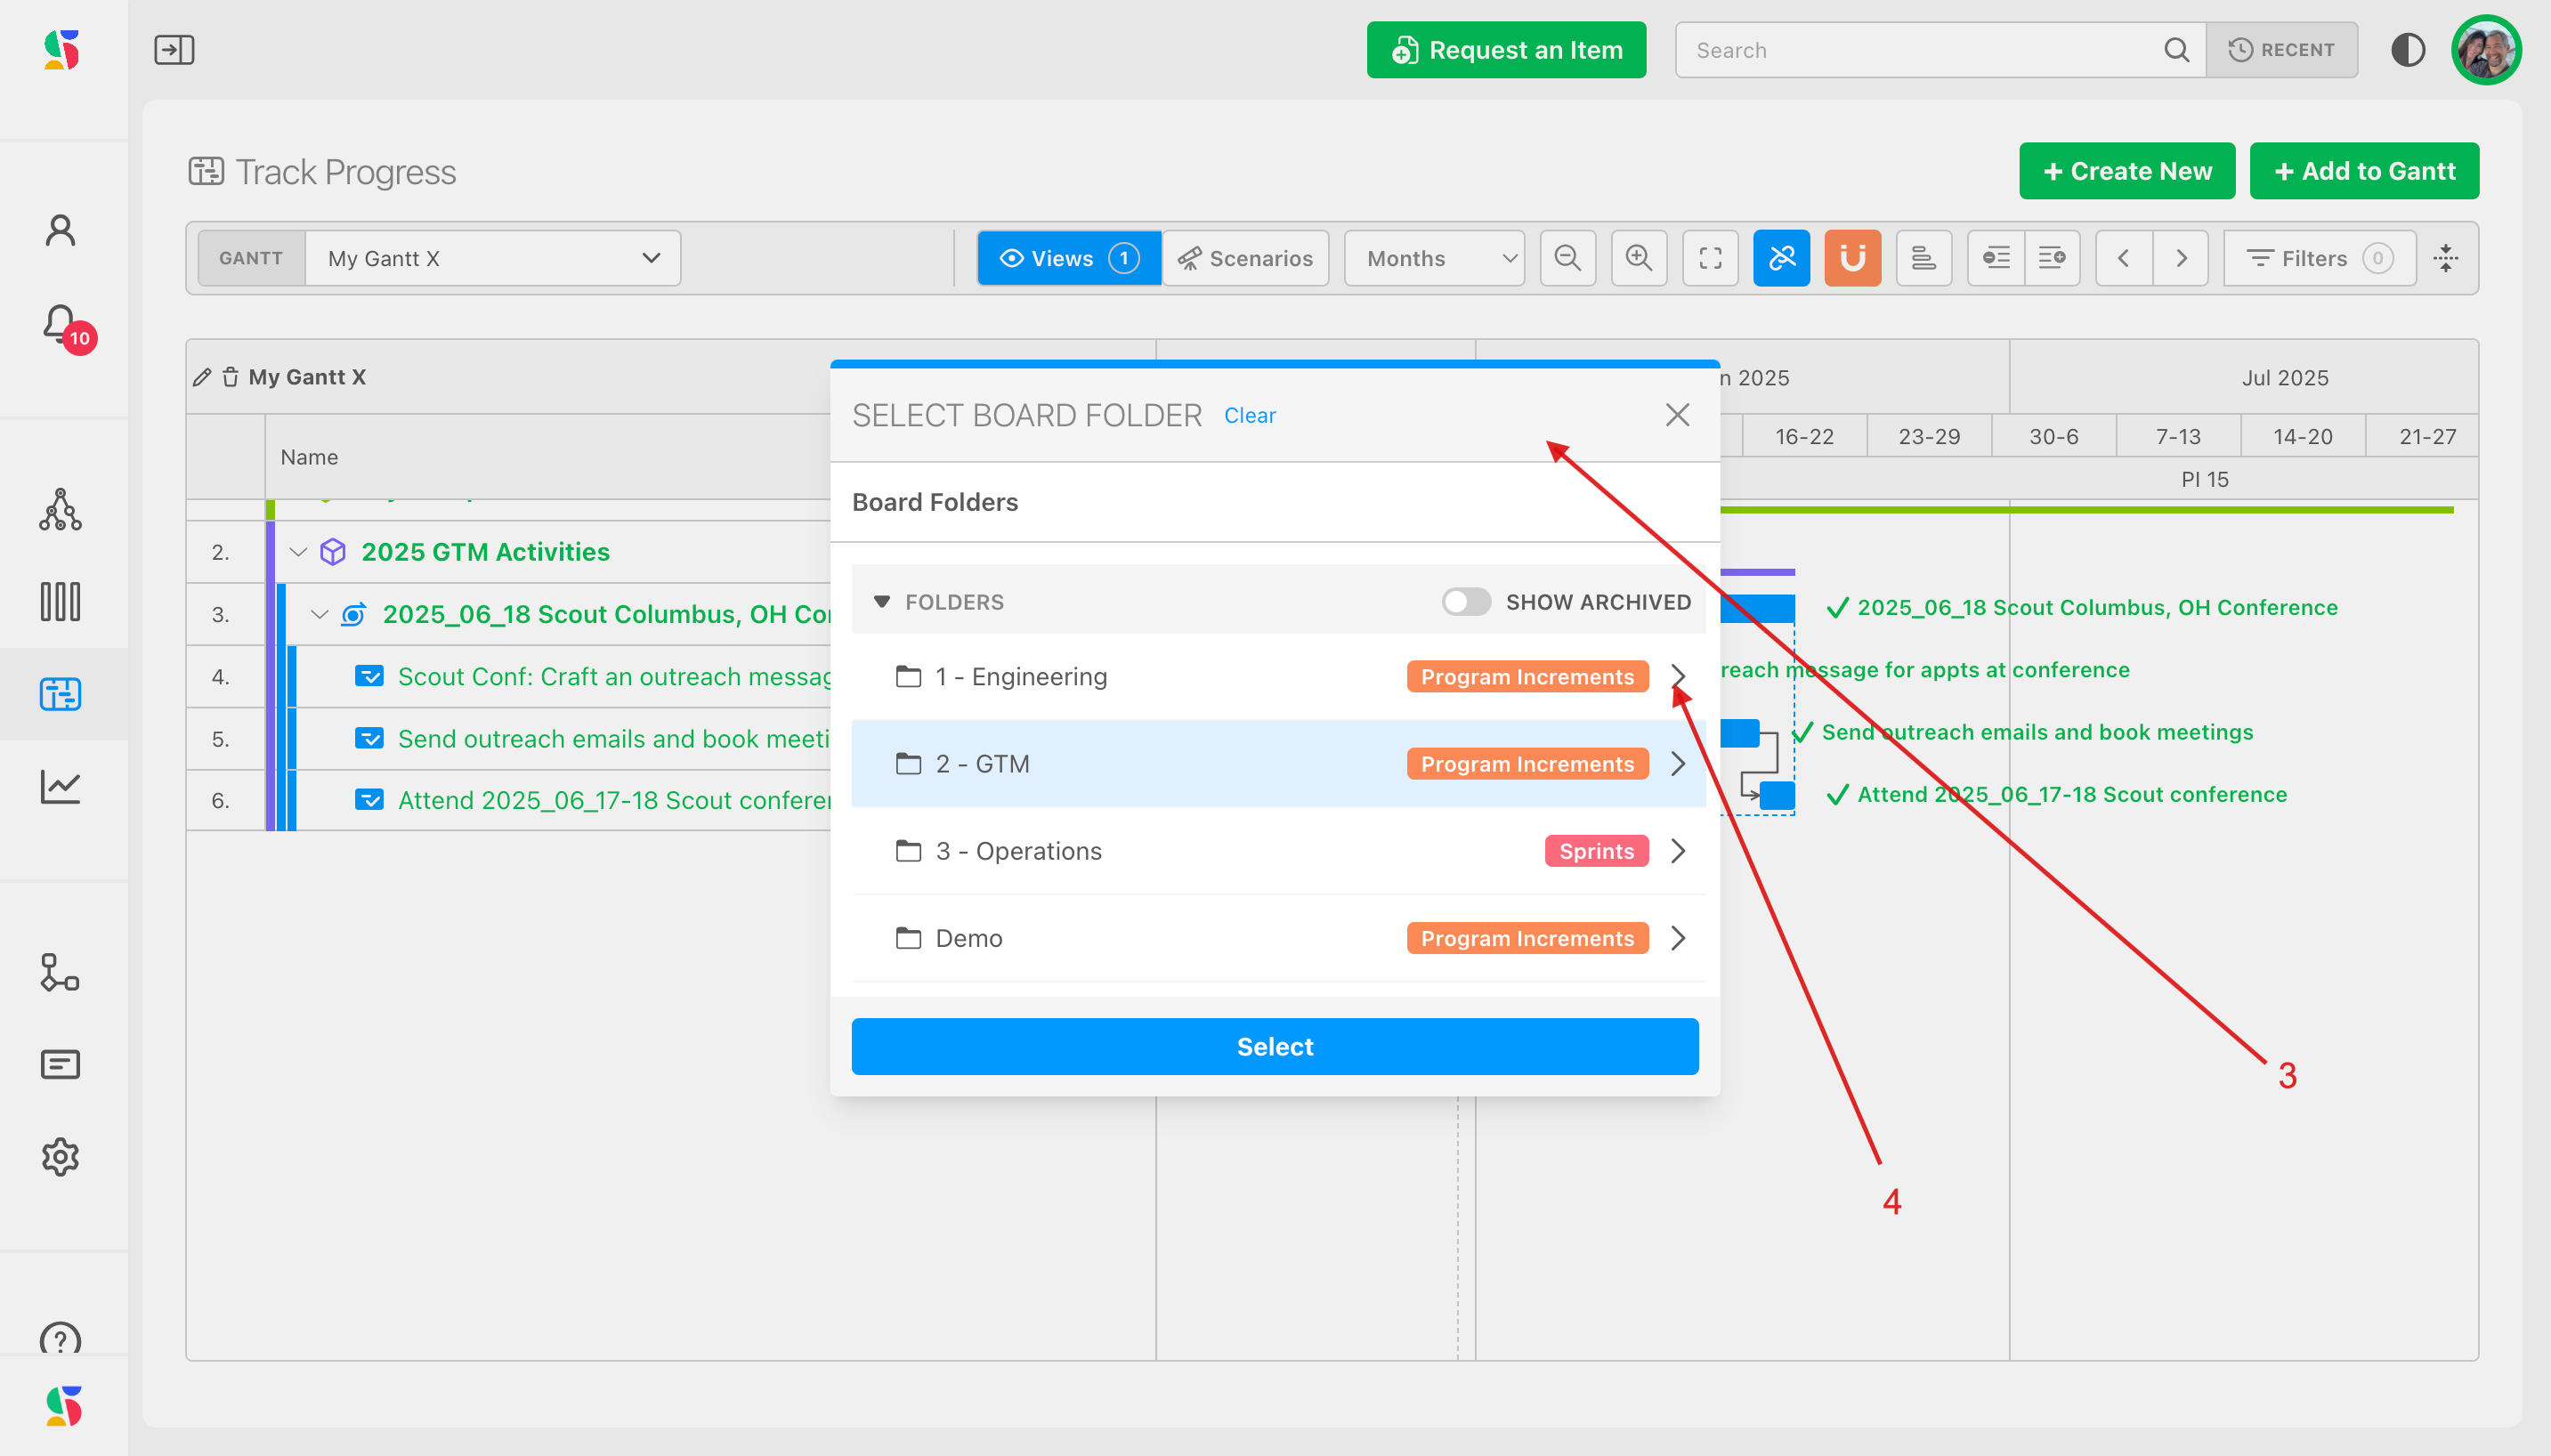
To choose or change the folder, click the magnet. Here the chart shows a 2-week cadence (2), and the dialog (3) lets you expand to the Engineering folder (4).
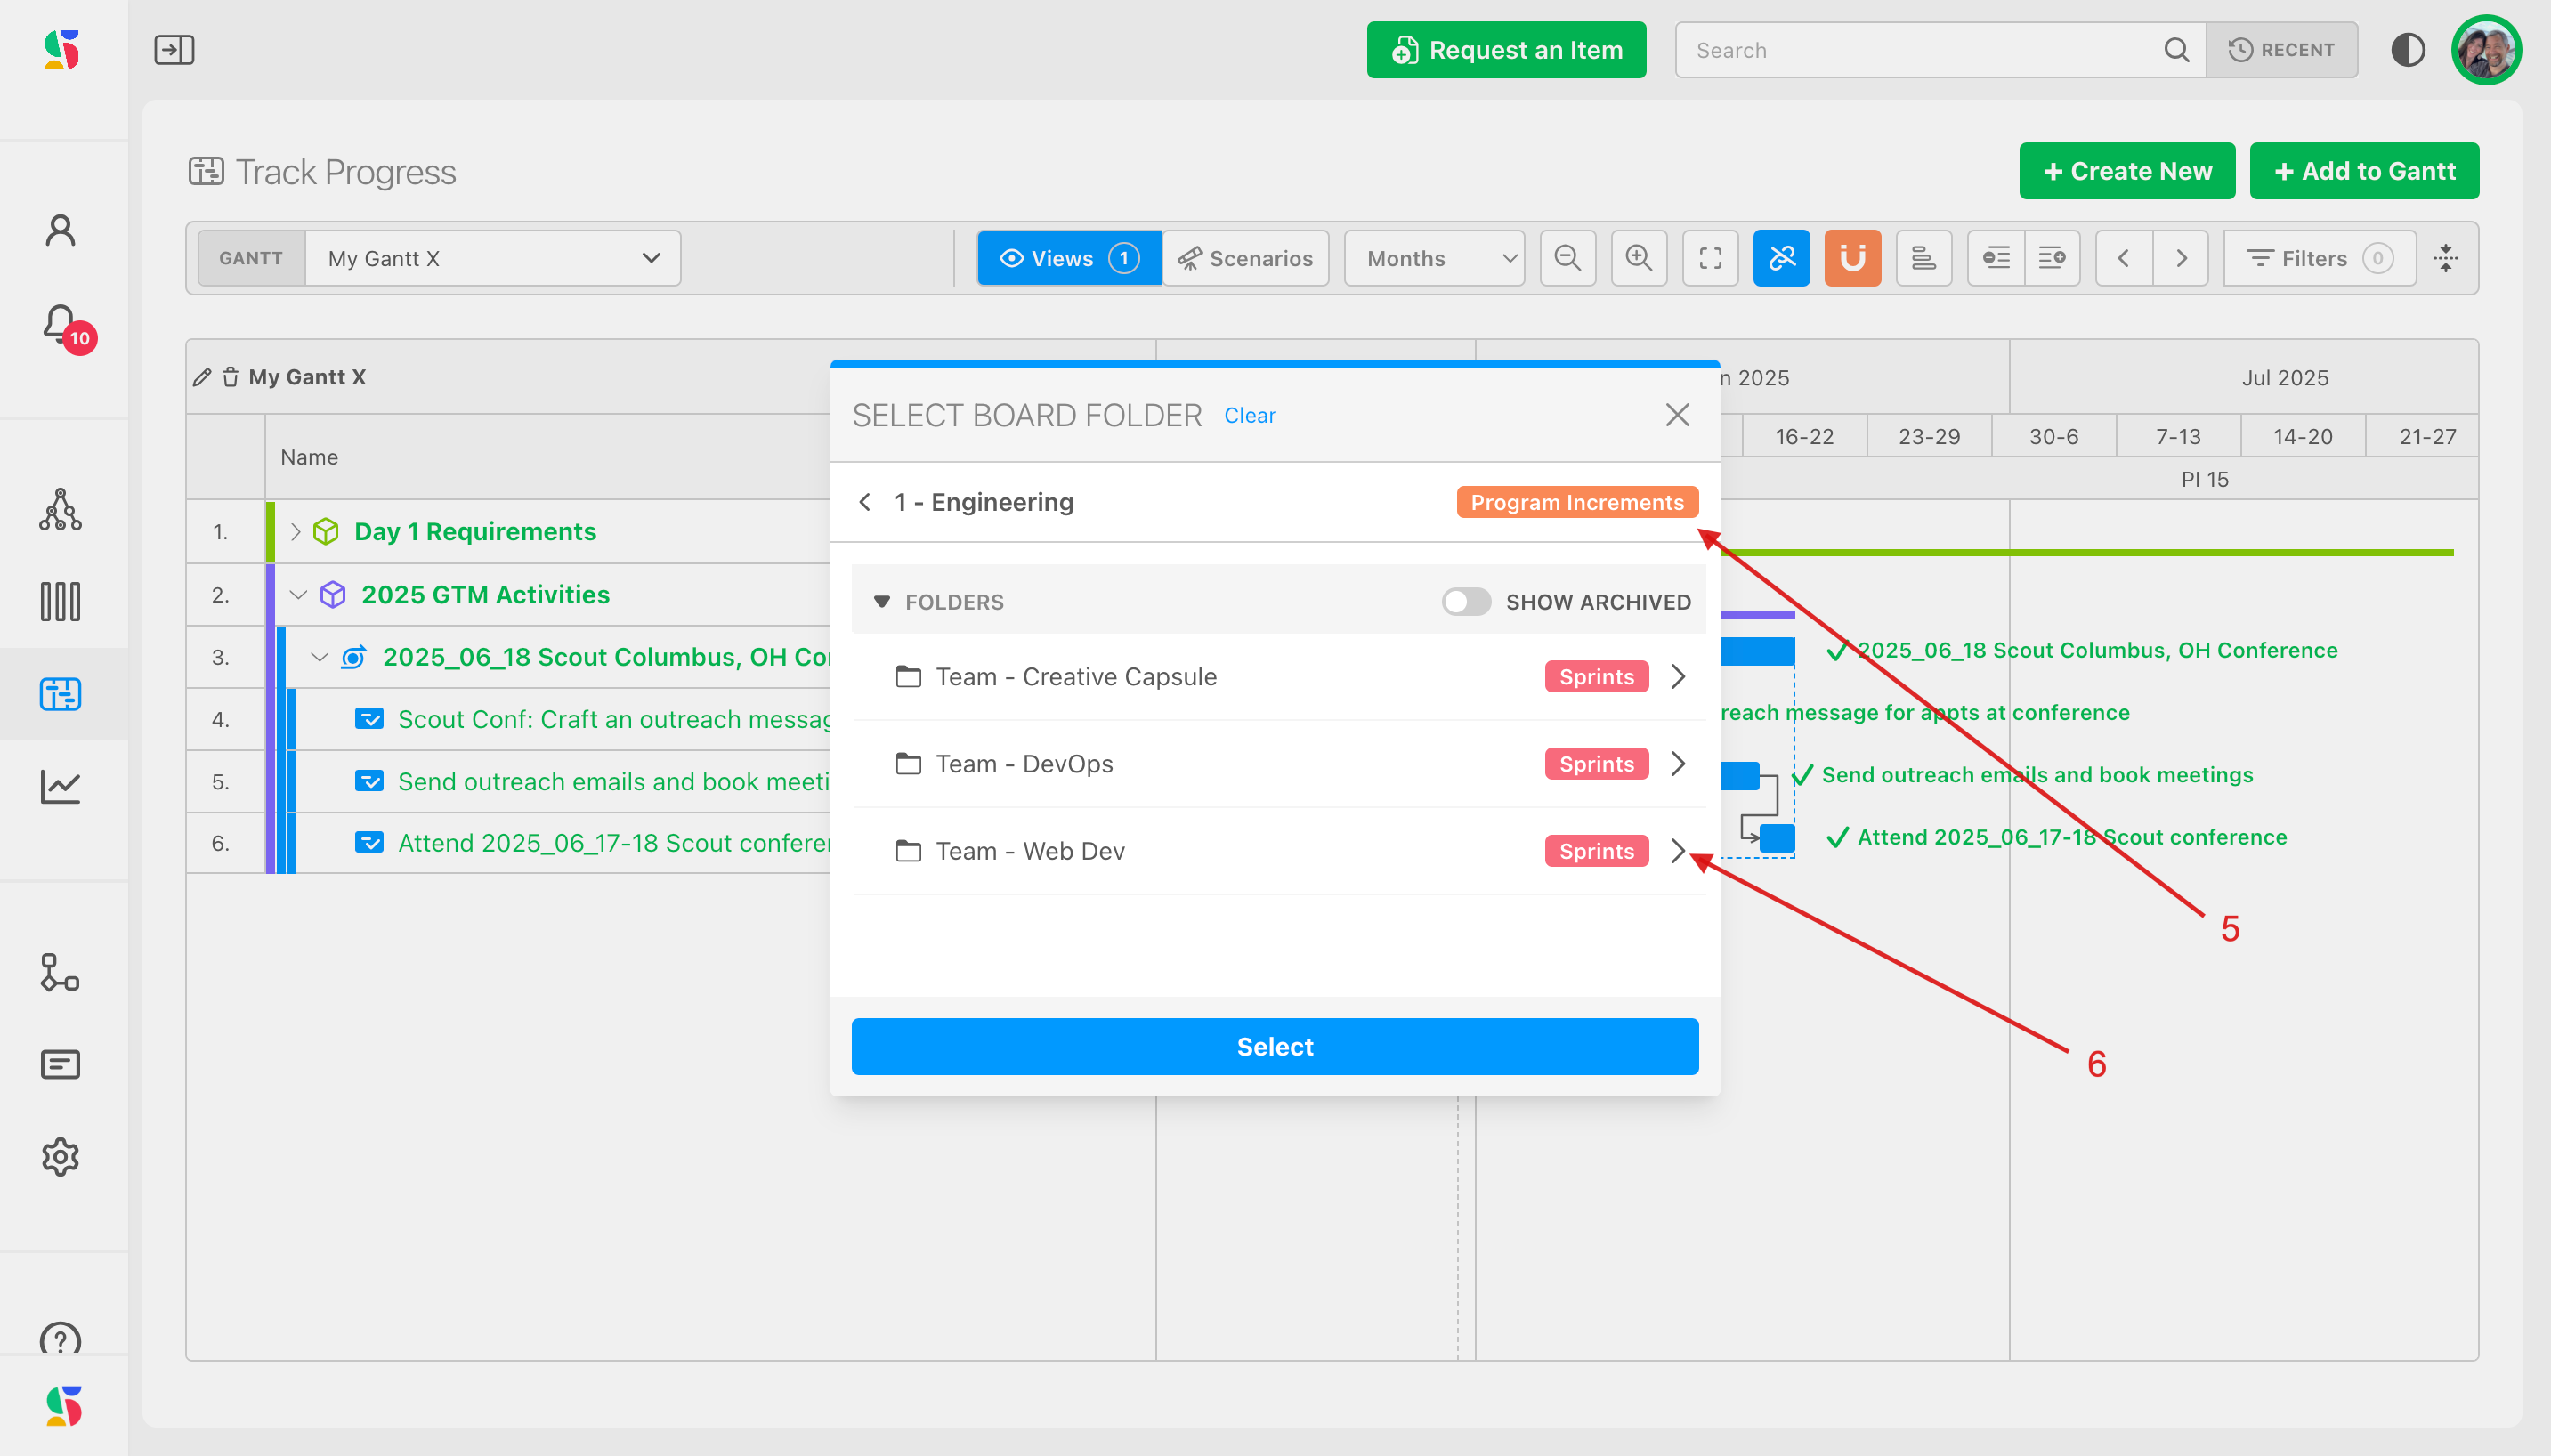
Select the program-increment folder for a longer planning cycle (5), or expand further to a single team's 2-week sprint folder (6).
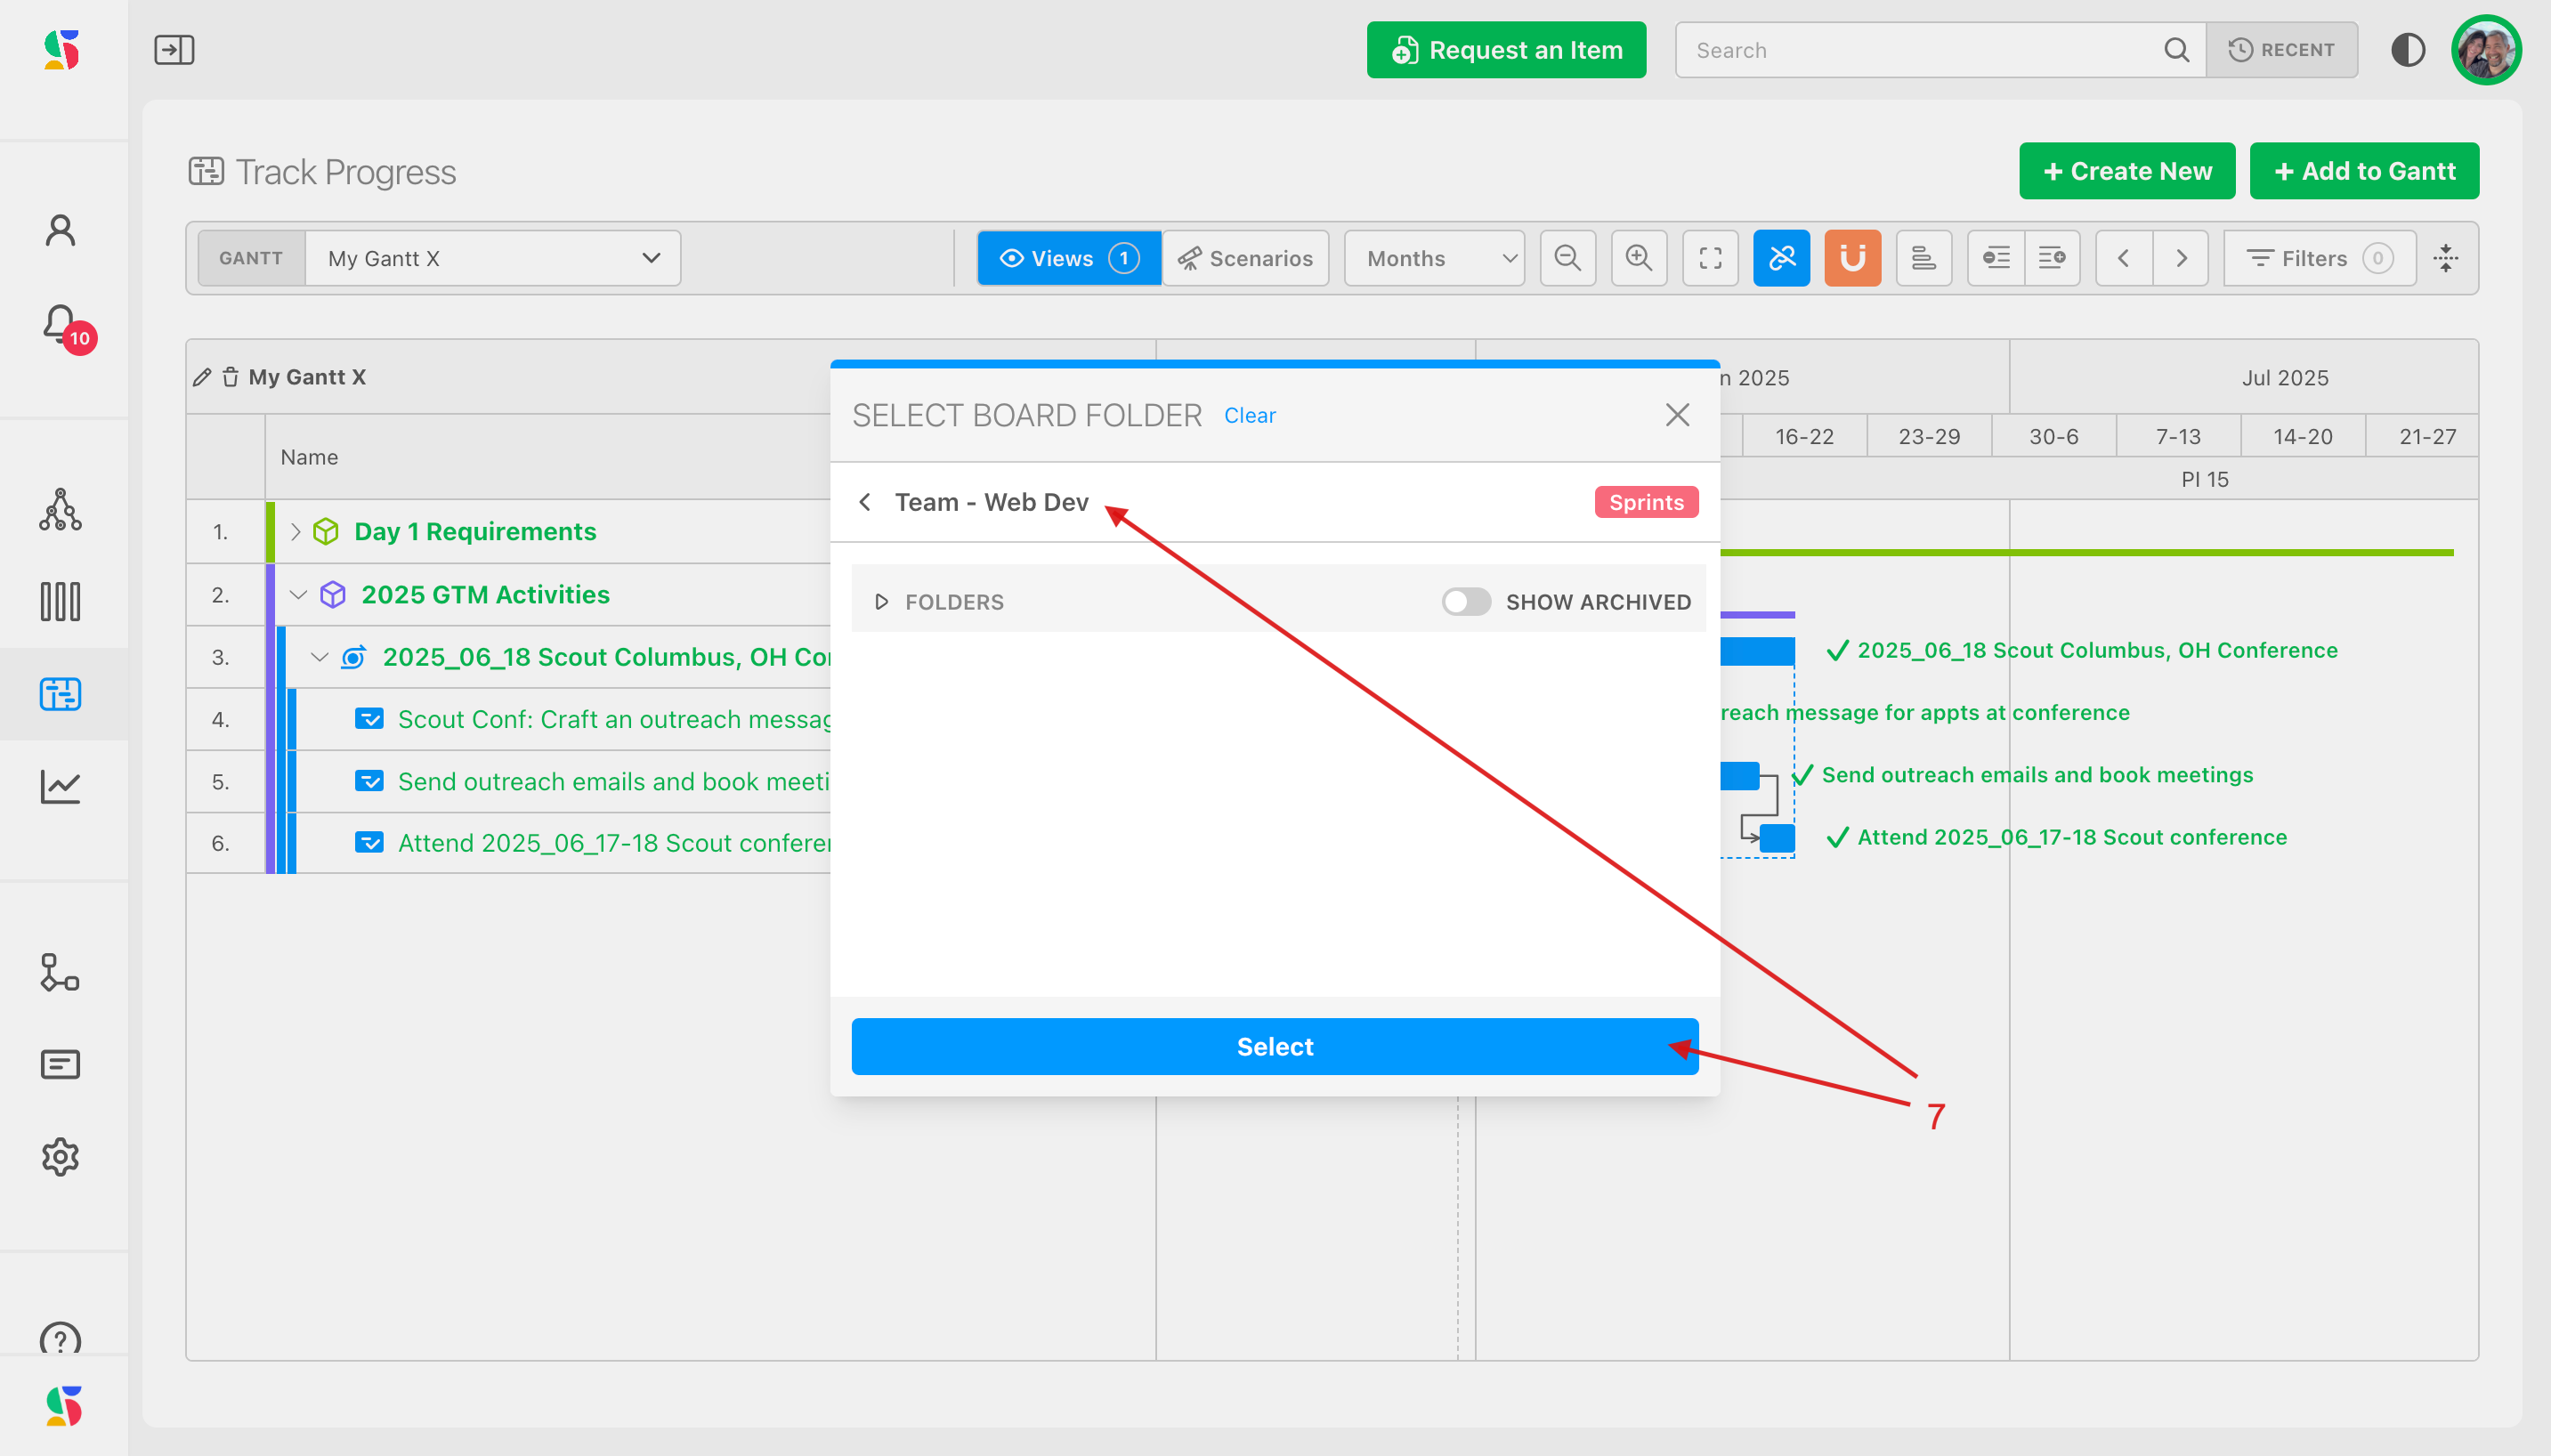
Click Select (7).
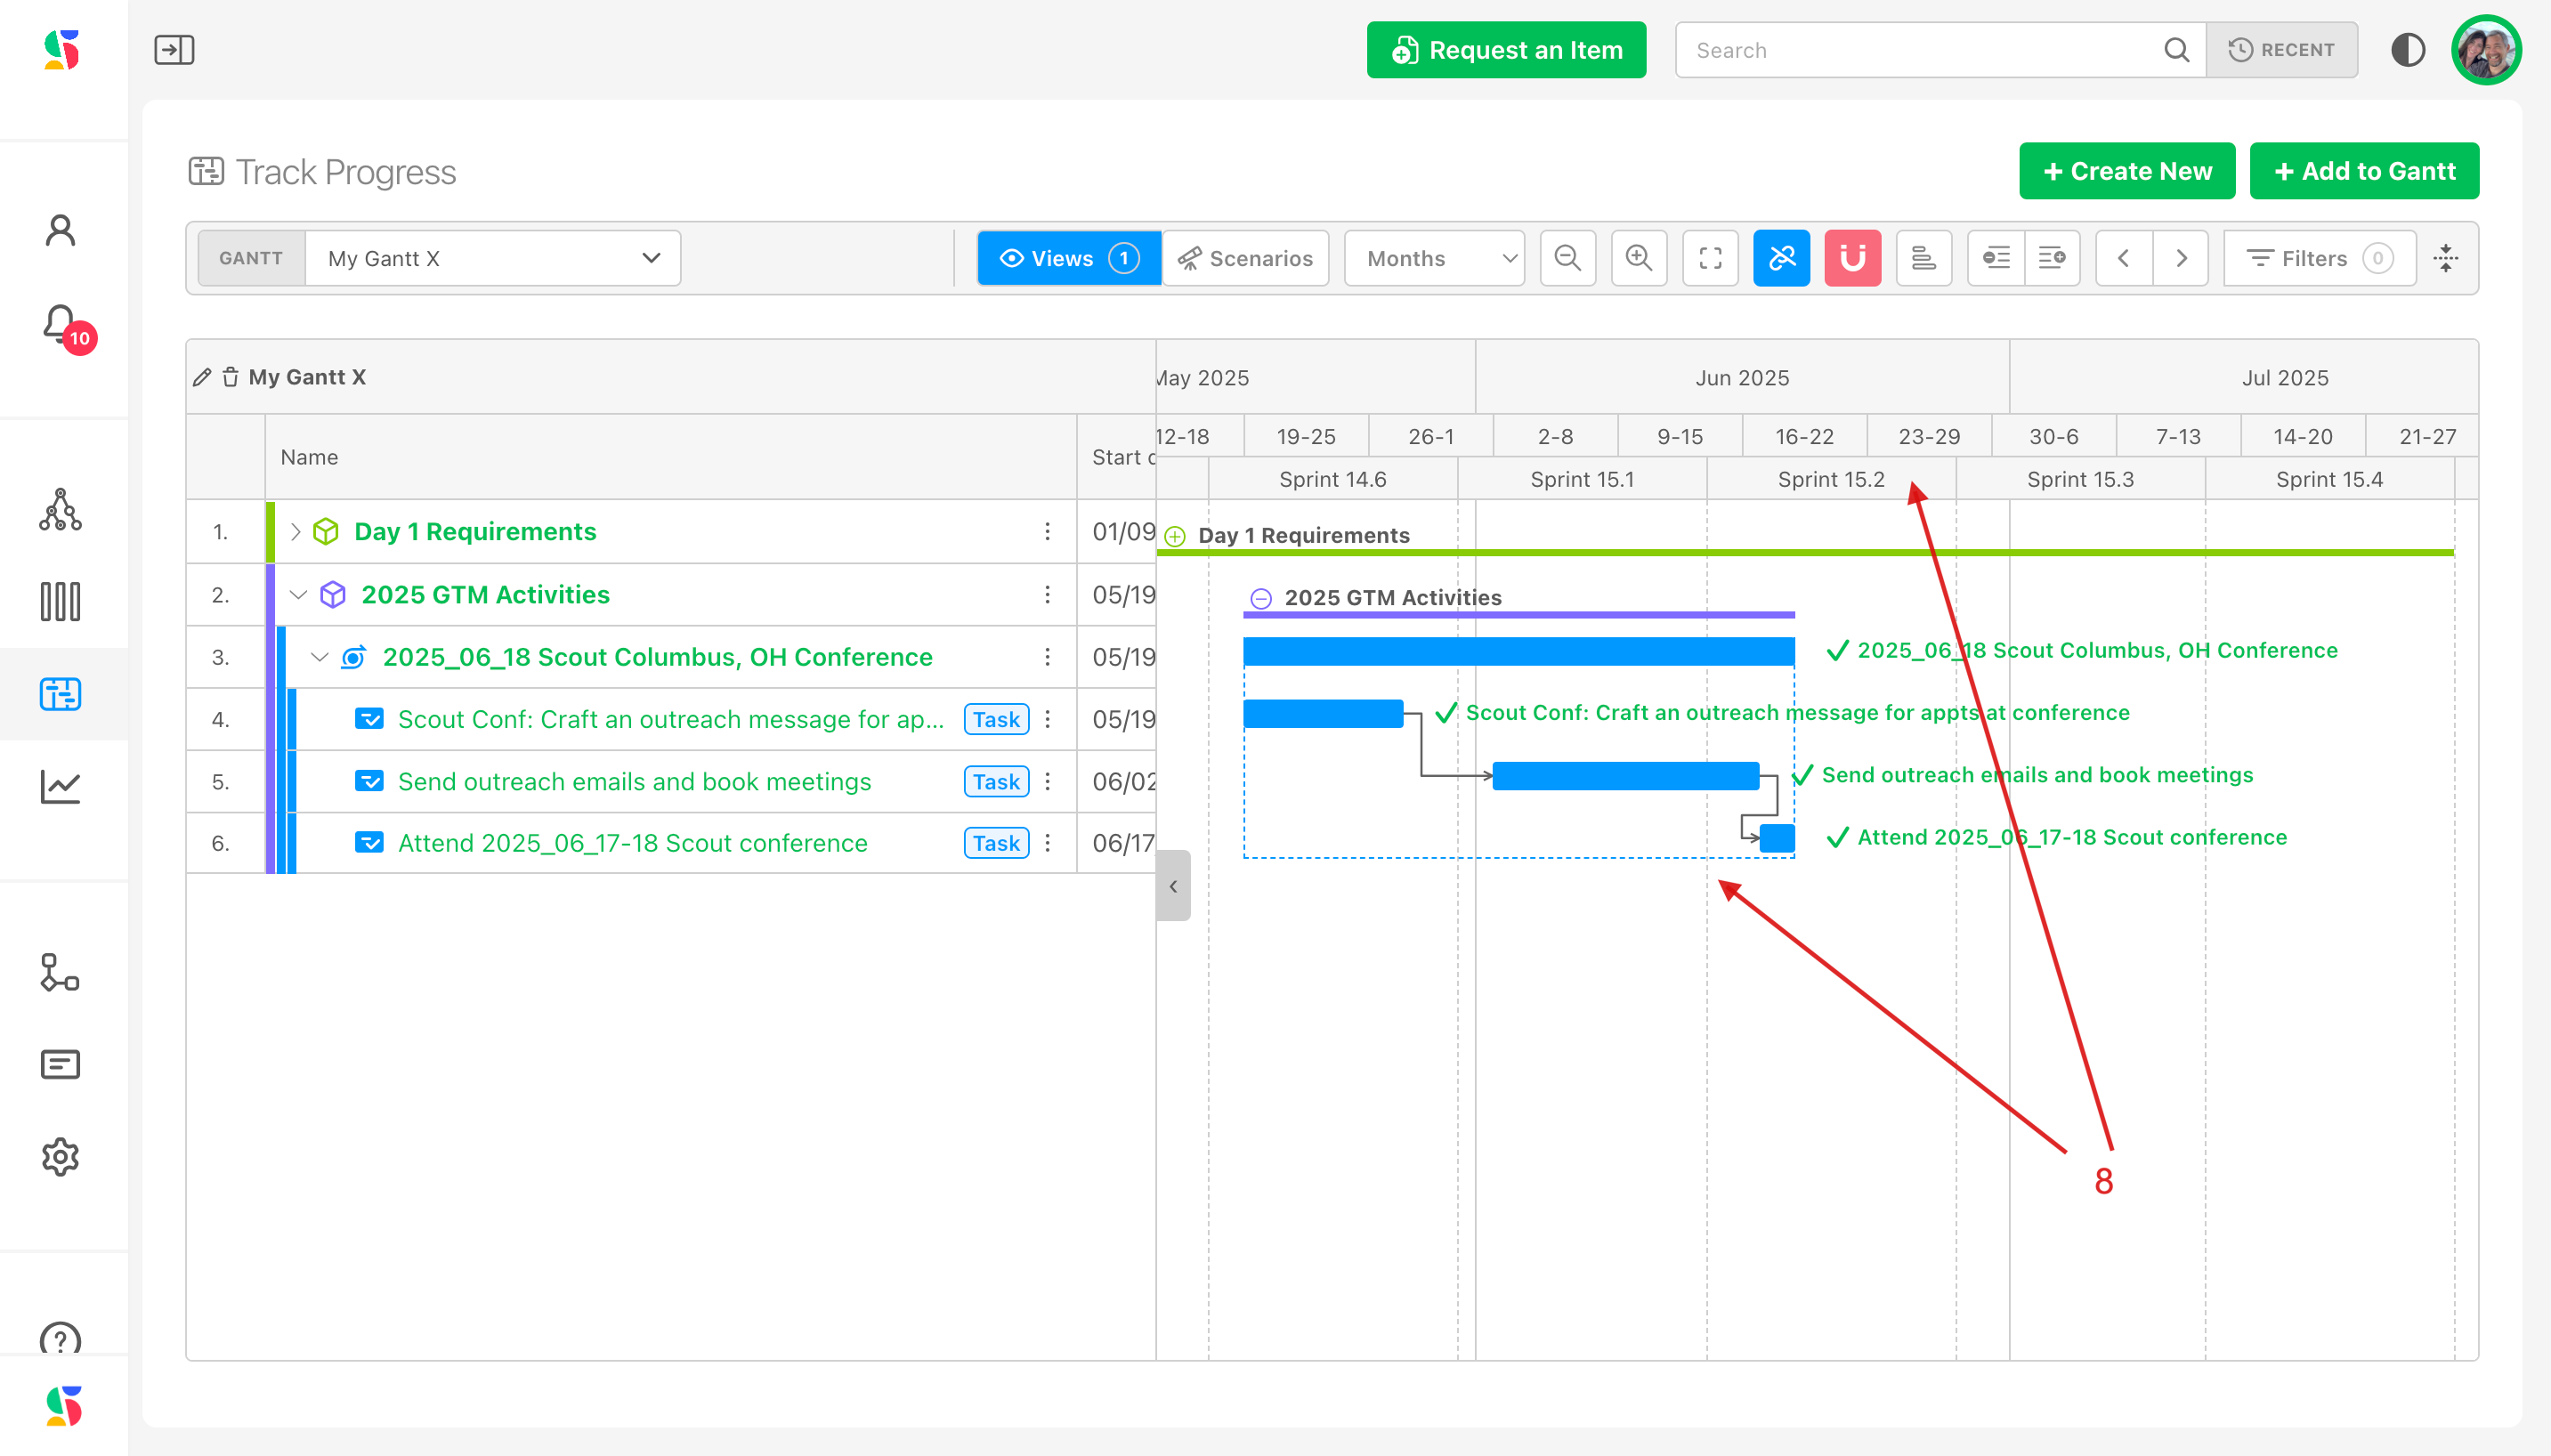
The cadence appears as bands with the sprint names in the header (8).
Why the lens is worth it
In the example, the GTM team can see that most of their launch activities fall in WebDev's Sprint 15.3. The calendar dates sit right above the sprint names, so a conversation about "when" can happen in either team's vocabulary. Switch back to your own folder the same way any time.
If the organization setting Sync work item dates with their cycles is on, moving an item onto a cycle board also snaps its dates to that cycle. See Using cycle boards.
Draw and remove dependencies#
Dependencies in DevStride are the same Dependency / Dependent relationships you set in the item workspace; the chart just gives you a place to draw them. There are two link types on the chart:
| Link | Line | Meaning |
|---|---|---|
| Dependency | Orange, solid, from the end of the blocker to the start of the blocked item | The target item depends on (is blocked by) the source. Linked mode follows these. |
| Related | Green, dashed, start to start | An informational connection. Never moves dates. |
To draw one:
- Hover the source bar and drag from the connector dot that appears at its edge.
- Drag onto the target bar. A preview line follows the pointer.
- Release, then choose Dependency or Related from the Select relation type menu (or Cancel).
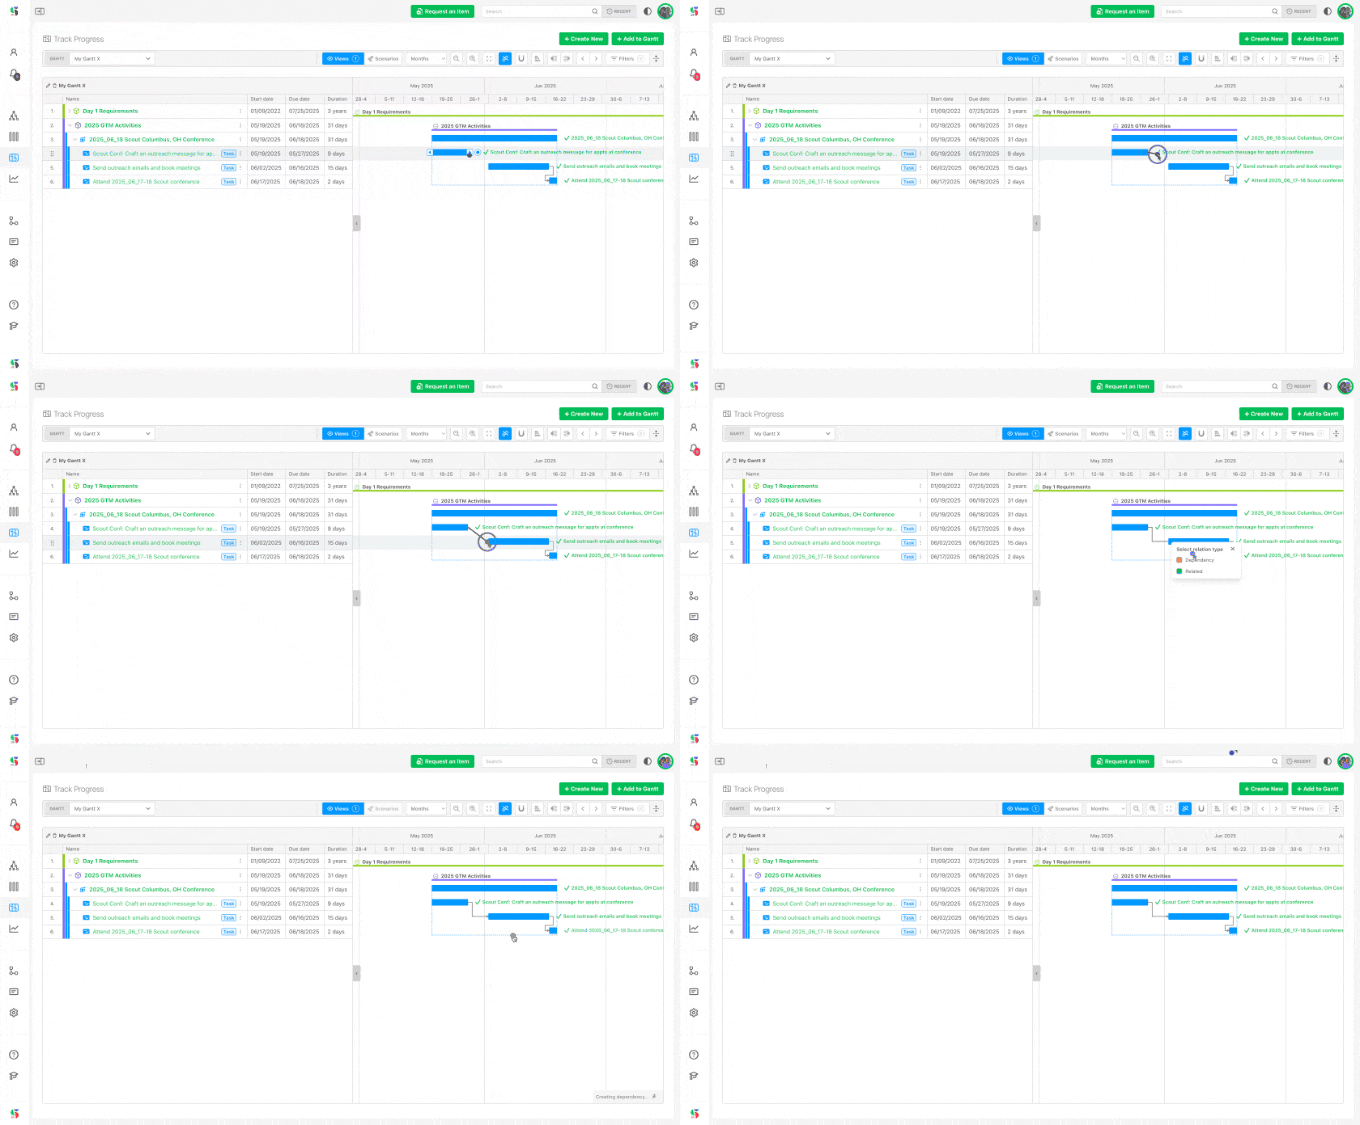
The chart refuses links that would not make sense and says why in the status strip: Not allowed. Direct ancestor or descendant (you cannot link a workstream to something inside it, or link two items that are already related) and Not allowed. Dependency loop (the link would make an item depend on itself through the chain). Milestones can be either end of a link.
To remove a link, click the line to select it and use the remove control that appears. Hover any bar to highlight all of its lines; Hide Relationships in Options hides them all.
Relationships also show in the table's Relationships column, in the item workspace, and in the Items Table. Click the relationships icon in the item workspace (1) for the full list (2).
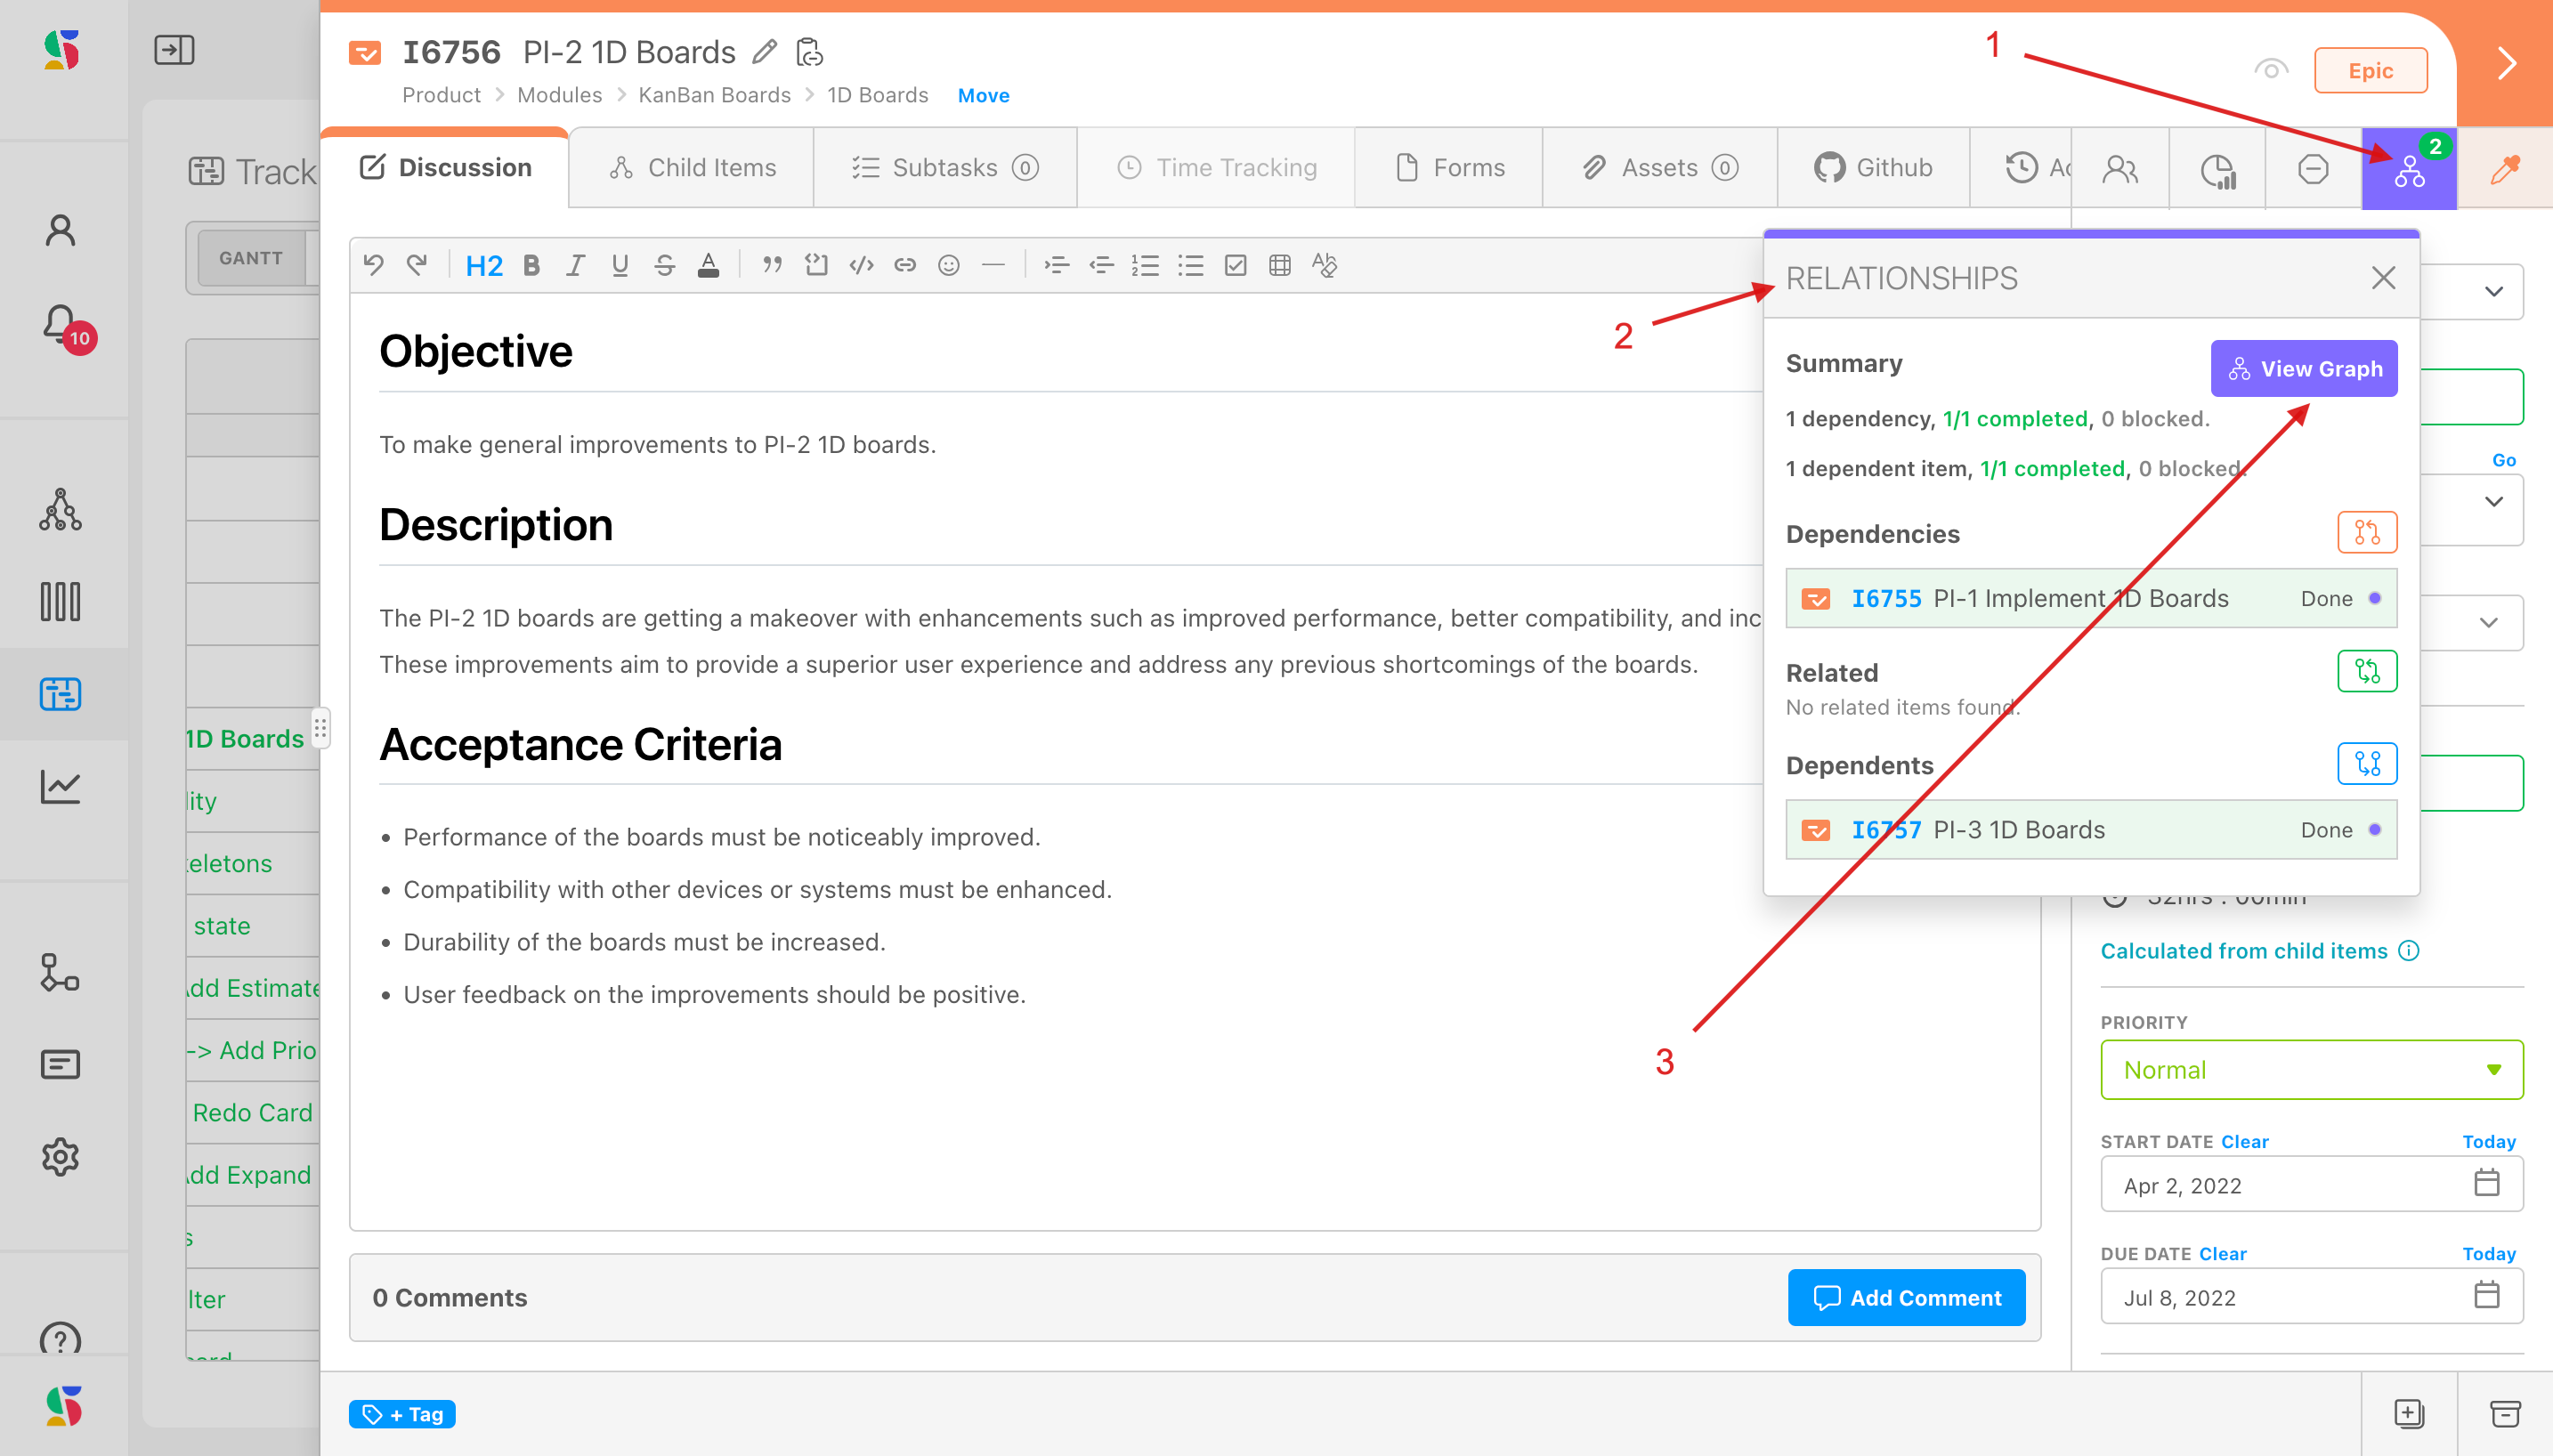
View Graph (3) renders the chain.
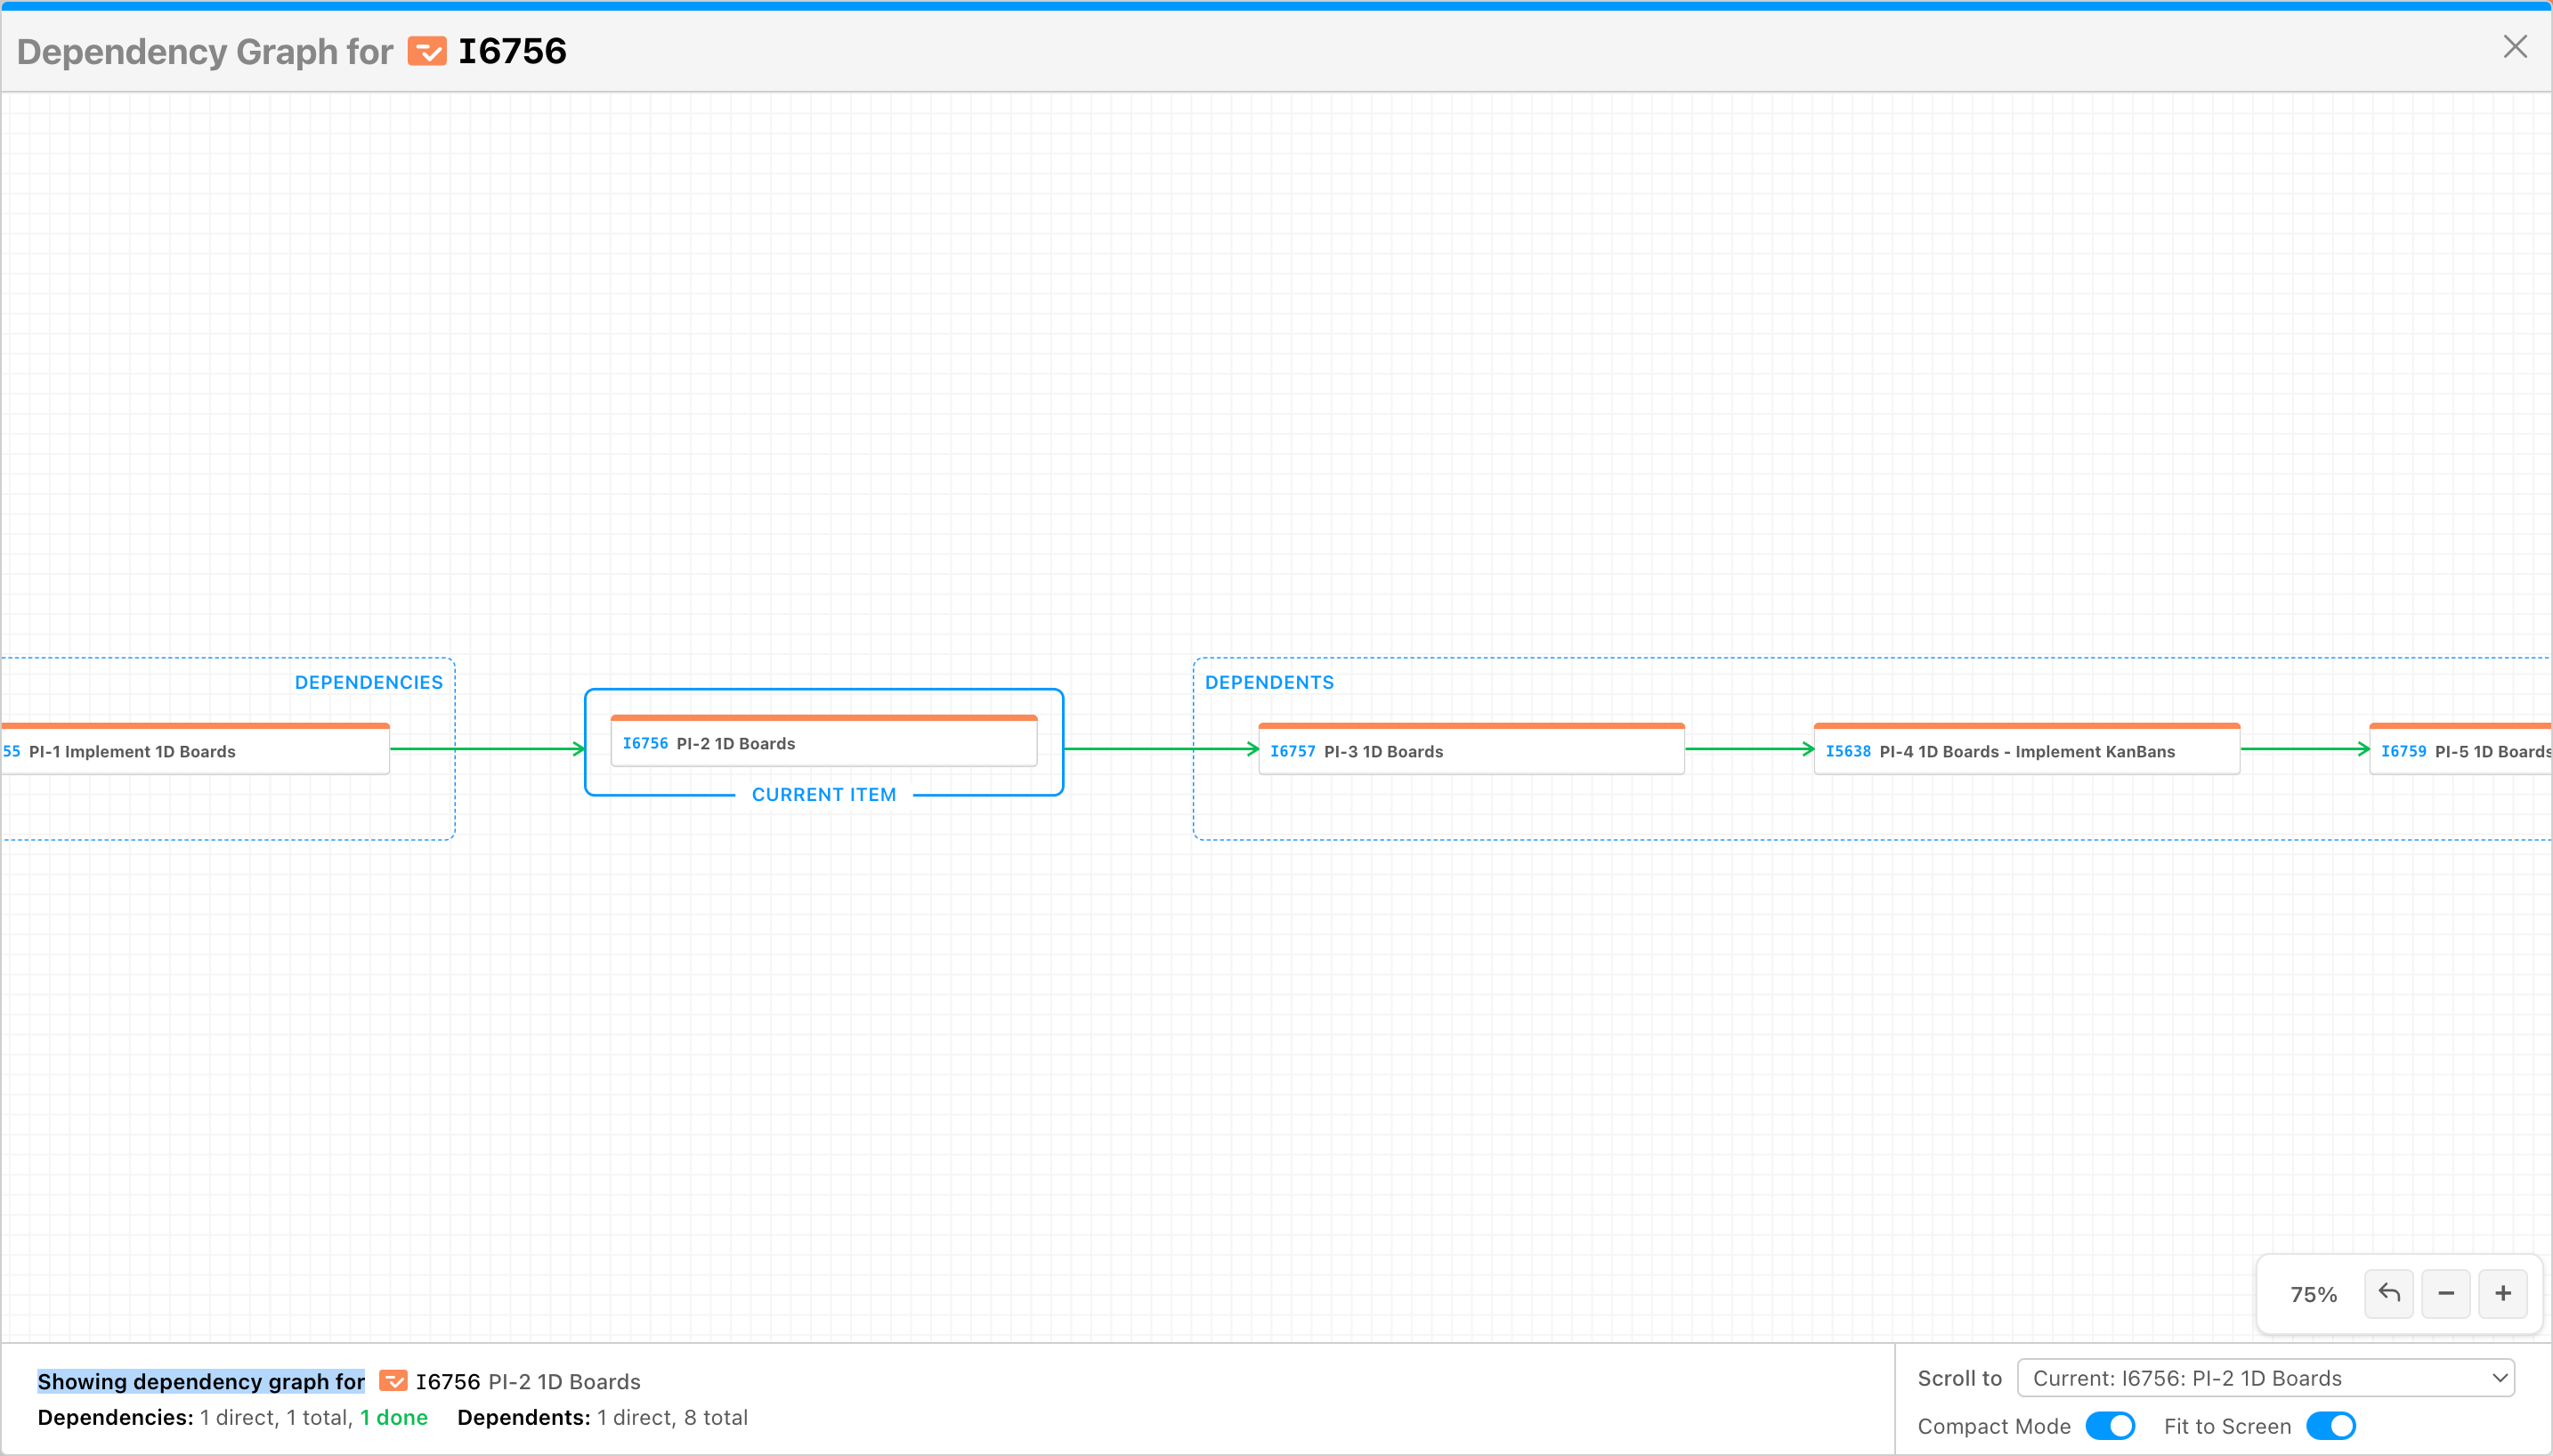
See Manage and Edit Dependencies and the Dependency Graph.
Linked and Unlinked mode#
The link / unlink button in the control bar decides what happens to dependent items when you move a due date on this chart.
- Linked mode (green link icon): Item actions will propagate down the dependency chain. Move a blocker's due date by 5 days and every item that depends on it, and everything that depends on those, moves 5 days too. Adding a dependency in Linked mode also pushes the dependent to start after the blocker if it currently starts earlier.
- Unlinked mode (unlink icon): Item actions will not propagate to its dependency chain. Only the bar you touched moves.
Press Shift + M to switch. The choice is remembered in your browser and saved in views. The Scenario Information list shows which mode each recorded move used.
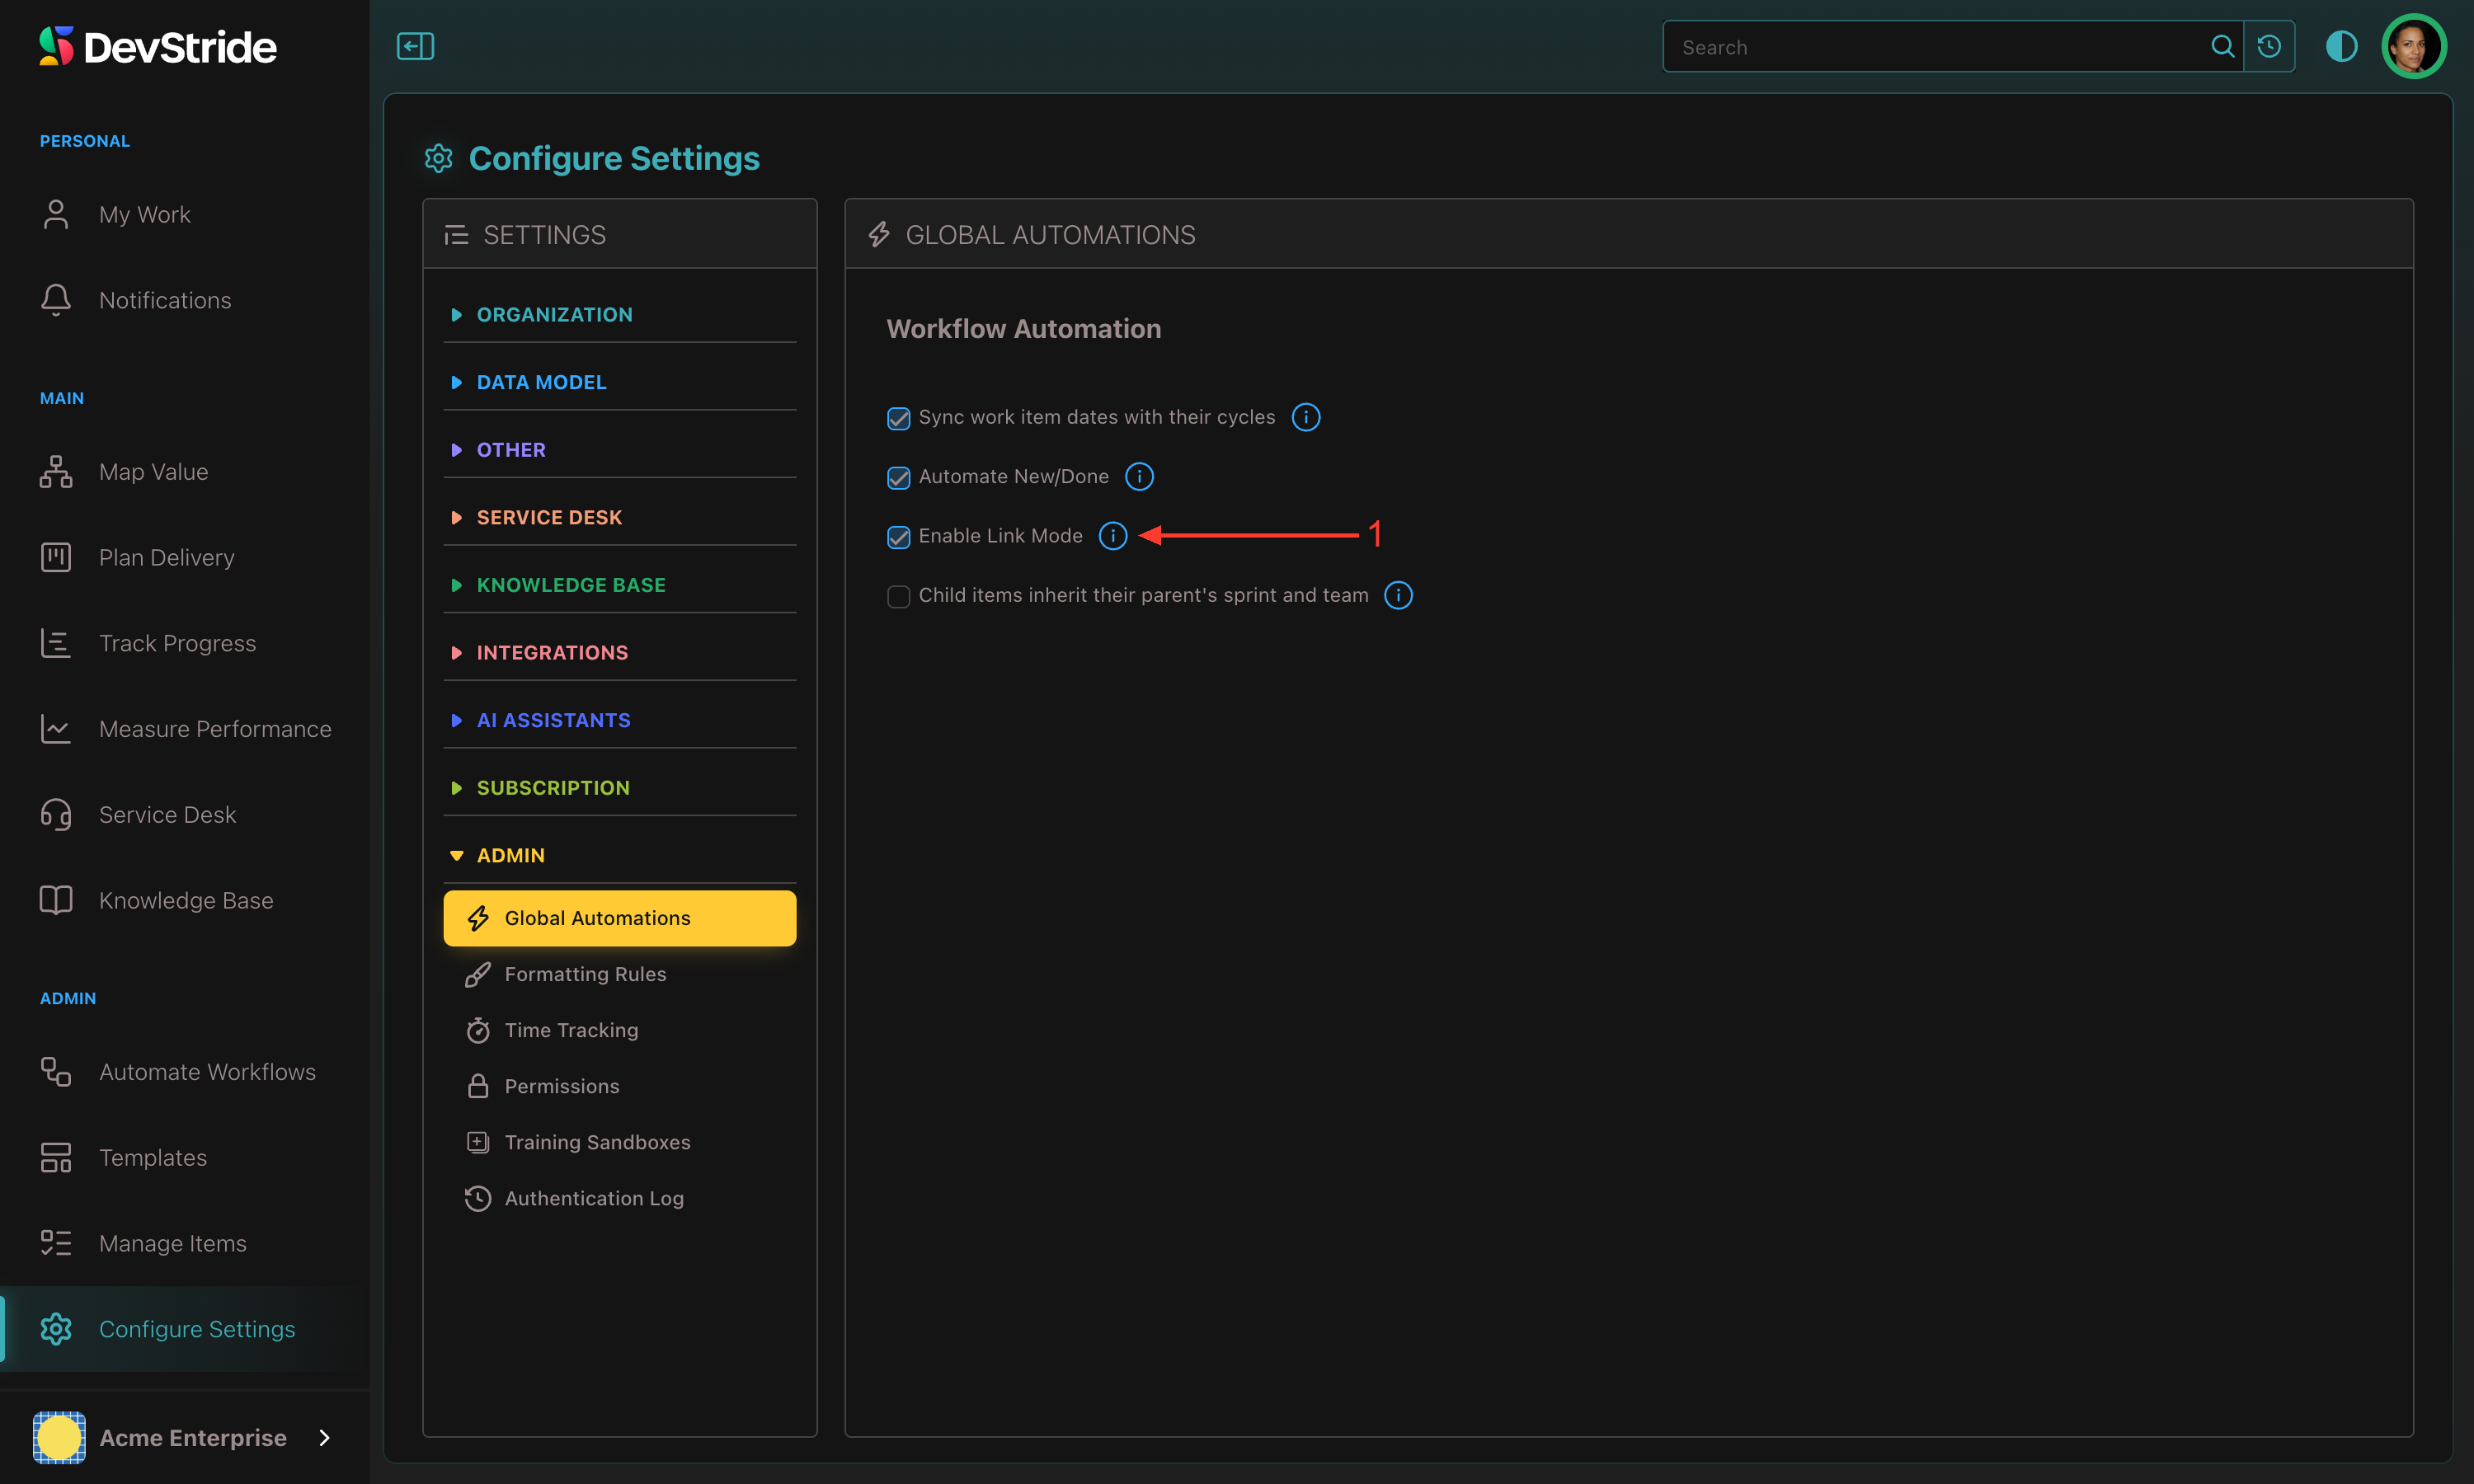
The mode on the chart overrides the organization default for actions taken on the chart. For how the cascade is calculated, what triggers it, and the organization-wide setting, see Link Mode.
Try changes before committing them#
If you want to drag bars around to answer "what if the API work slips two weeks?" without changing anyone's dates, record a scenario first. Date moves made while recording stay in your browser until you save them as a named snapshot, and the snapshot can then be overlaid on the live chart for comparison. See Scenario Planning.