
Grid
How the Weekly Logs grid is laid out — header, toolbar, sections, cells, task rows — and how auto-save works.
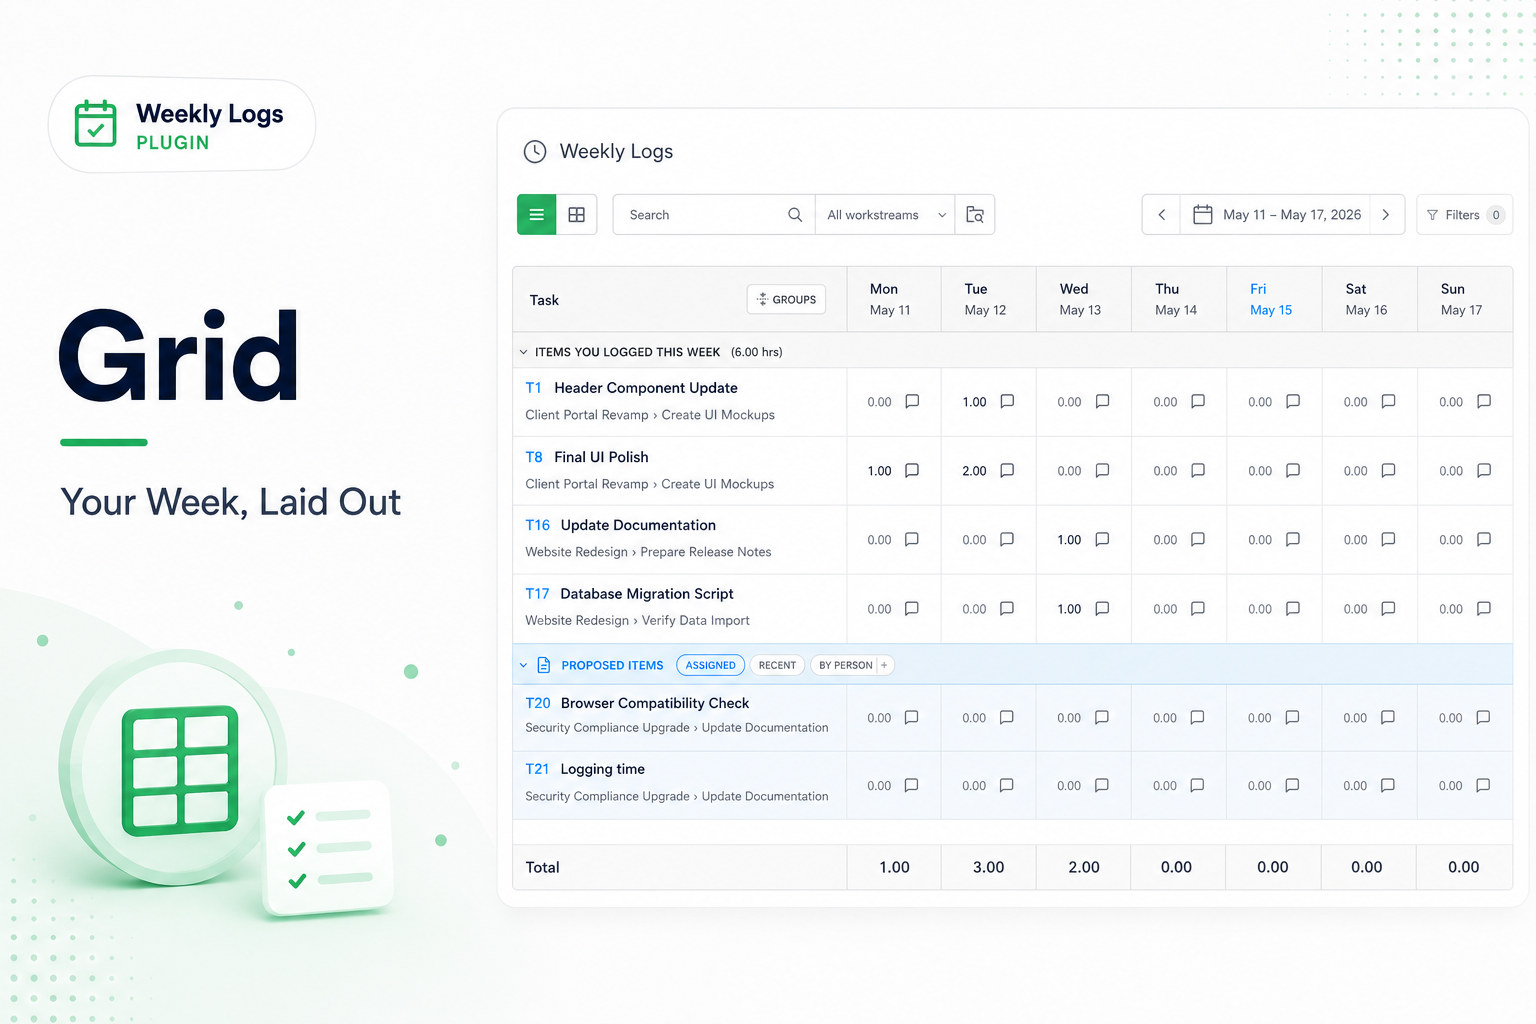
The grid is the whole plugin: every task you are tracking is a row, each day of the week is a column, with a Total column on the right and a pinned Total row at the bottom that sums every day and the week.
Header#
Above the toolbar: the Weekly Logs title, a save-state indicator (Draft-Saved, Auto-Saving, Saved), and the Export button.
Toolbar#
The toolbar holds the view toggle, week navigation, search, filters, and the Team Logs switch — each covered on its own page.
- Collapse it with the control on its right, or Ctrl+Shift+F / Cmd+Shift+F. A Toolbar button then appears next to Export to bring it back.
- Active filters show as chips between the toolbar and the grid.
Grid sections#
Each section collapses independently.
- Items You Logged This Week — every task with at least one entry this week.
- Proposed Items — suggestions: in-progress work assigned to you, items from last week, and items from a teammate's timesheet. See Proposed Items.
Cells#
A cell is one day on one task. Today is highlighted in the column header. Click a cell to enter hours; hover for the notes icon (or press Space) to add a description to that entry.
Task rows#
Each row shows the item number and title, a breadcrumb of the workstream path, a notes icon on any cell with a description, and a delete icon in the total cell that removes every entry for that task this week.
Auto-save#
There is no Save button.
- Each keystroke is saved to a local draft at once (Draft-Saved).
- Every few seconds the draft syncs to the server in the background (Auto-Saving, then Saved).
- If you close the tab mid-entry, the draft is restored when you return.